The slow part of the API was not the controller.
It was the repeated database read behind it.
The endpoint looked harmless: fetch one user by id, return the response, repeat under load.
GET /users/{id}But under sustained traffic, that simple read path still paid the database cost on every request. The query was not broken. PostgreSQL was not failing. The application was just asking the database the same question over and over.
Redis did not make PostgreSQL faster. It reduced how often the API needed PostgreSQL at all.
That distinction matters. Caching is not magic performance dust. It changes the shape of the request path.
The Benchmark Setup
The test was intentionally controlled. I wanted to measure the impact of Redis on one read-heavy Spring Boot endpoint without mixing in unrelated architecture changes.
- Backend: Spring Boot
- Database: PostgreSQL
- Cache: Redis running locally
- Load testing tool: JMeter
- Endpoint tested:
GET /users/{id} - Same load applied across all scenarios
The benchmark compared three request patterns:
| Scenario | Behavior | Why It Matters |
|---|---|---|
| No Cache | Every request reads from PostgreSQL | Baseline database-bound path |
| Mixed Load | Roughly 80% cache hits and 20% misses | Closer to a realistic production cache |
| Cache Hit | Same request repeated and served from Redis | Best-case cache behavior |
The Request Path Changed
Without Redis, the request path was simple but expensive under repetition:
Request -> Spring Boot -> PostgreSQL -> Response
With Redis, the request path added a decision point:
Request
  -> Check Redis
  -> Cache hit: return cached user
  -> Cache miss: query PostgreSQL
  -> Store result in Redis
  -> Return response
A cache hit avoids the database entirely. A cache miss still pays the database cost and also pays the cache write cost. That is why hit ratio matters more than the mere fact that Redis exists.
Measured Results
| Scenario | Avg Latency | P95 | P99 |
|---|---|---|---|
| No Cache | 31.82 ms | 217 ms | 224 ms |
| Mixed Load | 8.24 ms | 12 ms | 14 ms |
| Cache Hit | 0.95 ms | 1 ms | 2 ms |
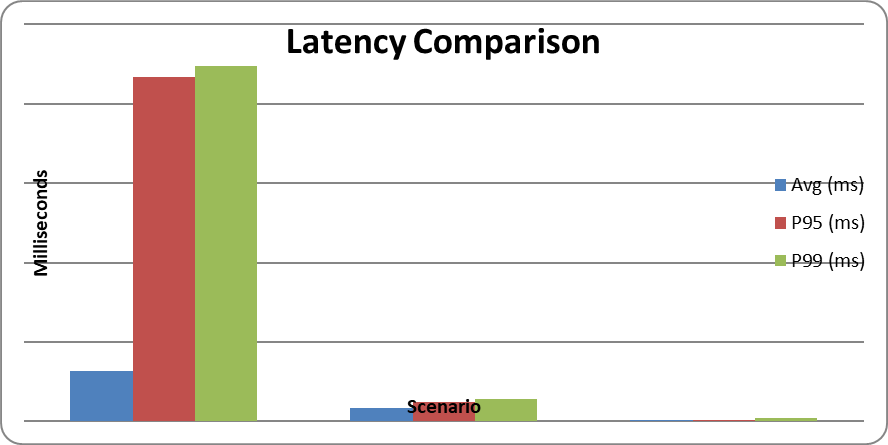
The average latency improvement was dramatic. The cache-hit case went from 31.82 ms to 0.95 ms, which is roughly a 30x reduction.
But the more interesting result was the tail latency.
Without caching, P95 reached 217 ms and P99 reached 224 ms. With a cache hit, P95 was 1 ms and P99 was 2 ms. The slow tail nearly disappeared.
The biggest win was not only faster average latency. It was predictability.
Why The Baseline Had Spikes
The no-cache path depended on PostgreSQL for every request.
Even when the query is normally fast, a database-backed endpoint can still show tail latency because each request competes for shared resources.
- Database connection availability
- Buffer cache state
- Query execution time
- JVM allocation and serialization
- Concurrent request pressure
- Occasional disk or background activity
That explains why the average was only 31.82 ms while P95 jumped to 217 ms. Most requests were acceptable. A meaningful minority were not.
Why The Mixed Scenario Matters
The cache-hit scenario is useful because it shows the upper bound of Redis benefit.
The mixed scenario is more useful for production thinking.
Real systems rarely have 100% cache hit ratio. Data expires. Keys vary. Users request cold objects. Deployments clear memory. Writes invalidate old values.
In the mixed case, average latency dropped to 8.24 ms and P95 dropped to 12 ms. That is still a major improvement over the database-only baseline.
This tells us the cache does not need to be perfect to be valuable. It needs to absorb enough repeated reads to keep the database off the critical path most of the time.
A Minimal Cache Shape
In Spring Boot, the read path often starts with a small annotation like this:
@Cacheable(value = "users", key = "#id")
public UserDto findUserById(Long id) {
    return repository.findById(id)
        .map(UserDto::from)
        .orElseThrow();
}
That code is simple, but the operational behavior behind it is not. The annotation creates a new contract: key design, TTL, invalidation, payload size, serialization, and hit ratio now matter.
The First Wrong Conclusion
The wrong conclusion is: Redis makes APIs fast.
The better conclusion is: Redis makes repeated reads cheap when the cache strategy matches the workload.
If the endpoint has low reuse, Redis may add overhead without much benefit. If invalidation is wrong, Redis can return stale data or churn constantly. If payloads are too large, serialization can become the new cost.
The benchmark worked because the workload was read-heavy and repeated enough for Redis to matter.
What I Would Watch In Production
If this endpoint existed in production, I would not stop after seeing faster response times.
I would add cache metrics next to API latency:
- Cache hit ratio
- Cache miss count
- Redis command latency
- Key cardinality
- Eviction count
- Serialized value size
- Database query count before and after caching
- P95 and P99 latency split by hit versus miss
That last split is important. A cache can improve overall latency while still leaving cache misses painfully slow. Without separating hits from misses, the average can hide the real user experience.
When Redis Helps
- The same data is read repeatedly.
- The data changes less often than it is read.
- The database query is expensive enough to avoid.
- Stale data risk is understood and bounded.
- The cache key is stable and specific.
- The team can monitor hit ratio and evictions.
When Redis Might Not Help
- Every request asks for different data.
- The data changes constantly.
- Correct invalidation is harder than the original query.
- Payloads are large and expensive to serialize.
- The bottleneck is not the database read path.
- The cache is remote and network latency dominates the saved work.
Limitations Of This Test
This benchmark used a local Redis instance, a simple data model, and one endpoint. Those constraints make the result clean, but they also limit the conclusion.
In a larger system, Redis may run across the network, values may be larger, invalidation may involve several services, and cache stampedes may appear during cold starts.
So the exact numbers should not be copied into another architecture. The lesson should be copied: measure the whole request path before and after caching.
Engineering Lessons
- Caching reduces database dependency; it does not improve the database itself.
- Tail latency matters more than average latency for user experience.
- Mixed hit/miss workloads are more realistic than perfect cache-hit benchmarks.
- Cache design includes key choice, TTL, invalidation, serialization, and monitoring.
- A cache is successful only if hit ratio and correctness hold under production traffic.
Conclusion
Redis made this Spring Boot API much faster because the endpoint was read-heavy and repetitive.
The cache-hit path reduced average latency from 31.82 ms to 0.95 ms. P95 dropped from 217 ms to 1 ms. Even the mixed workload stayed far below the database-only baseline.
But the real lesson is not simply “add Redis.”
The lesson is to find repeated database work, move it off the critical path, and then measure whether the cache is actually absorbing that work.
If your API feels slow, the problem may not be that PostgreSQL is bad. You may just be asking it the same question too often.