
Spring Boot 3 actuator benefits the developer monitoring the application by exposing metric information about the application, such as memory usage or server health status. The developer can easily monitor and maintain the application, which improves its performance.
You can choose to manage and monitor your application by using HTTP endpoints or with JMX.
Auditing, health, and metrics gathering can also be automatically applied to your application.
Prometheus benefits developer monitoring by gathering data from metrics that the Spring Boot 3 actuators provide. Prometheus uses the actuator data to create a graph. The developer can convert the data Prometheus collected into a visualization using Grafana.

Create a Spring Boot project with the actuator.
The developer can initialize the Spring Boot project usingSpring initializr.

1. Add required dependencies.
<dependencies>
  <dependency>
       <groupId>org.springframework.boot</groupId>
       <artifactId>spring-boot-starter-web</artifactId>
  </dependency>
    <dependency>
        <groupId>org.springframework.boot</groupId>
        <artifactId>spring-boot-starter-actuator</artifactId>
    </dependency>
    <dependency>
        <groupId>io.micrometer</groupId>
        <artifactId>micrometer-registry-prometheus</artifactId>
    </dependency>
</dependencies>
2. Configuring Spring Boot Actuator.
The developer can configure application properties by adding the following configuration to their application.properties or application.yml .
management.endpoints.web.exposure.include=*
management.endpoint.health.show-details=always
management.metrics.export.prometheus.enabled=true
management:
  endpoints:
    web:
      exposure:
        include: "*"
  endpoint:
    health:
      show-details: always
  metrics:
    export:
      prometheus:
enabled: true3. Check the Spring Boot Actuator status.
The developer can access Spring Boot Actuator using the path /actuator.
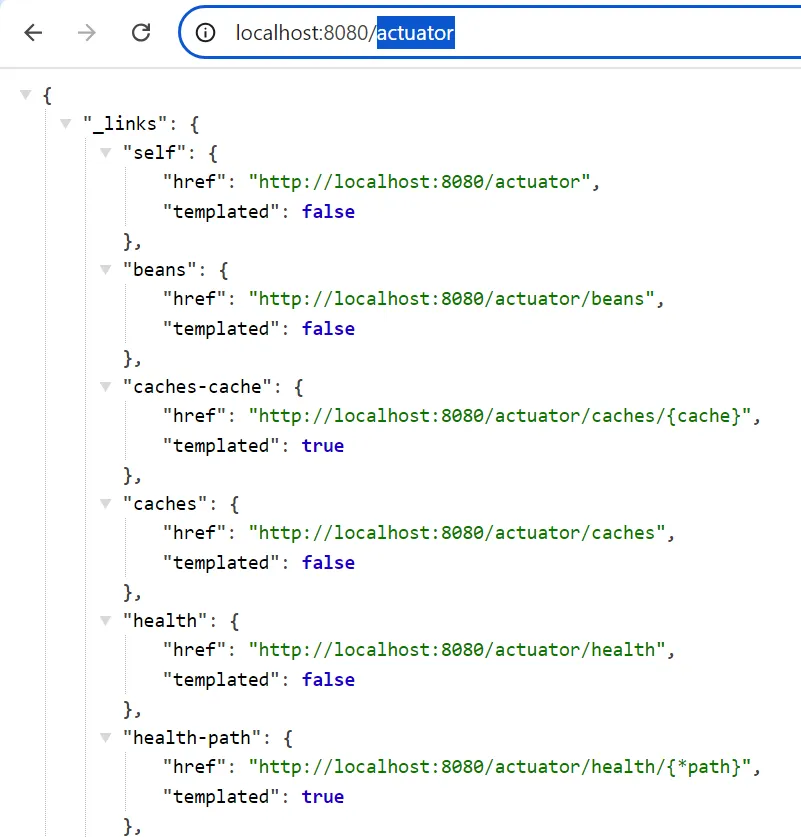
In the path, show all links that can be used to view the information about the server.
For example, the developer can check health using the path /actuator/health to check server status.
https://localhost:8080/actuator/health
{
"status":"UP",
"components":{
"diskSpace":{
"status":"UP",
"details":{
"total":1000186310656,
"free":183096074240,
"threshold":10485760,
"path":"D:\\workspaces\\prometheus\\.",
"exists":true
}
},
"ping":{
"status":"UP"
}
}
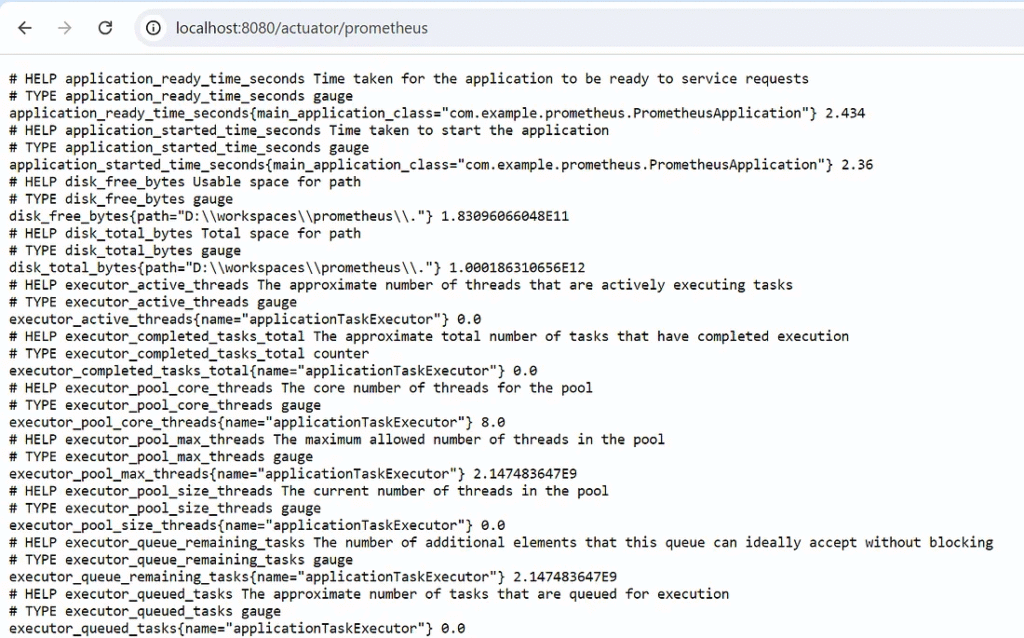
}4. Check that the Spring Boot Actuator exposes Micrometer metrics in Prometheus format.
The developer can access metrics in Prometheus format using the path. /actuator/prometheus
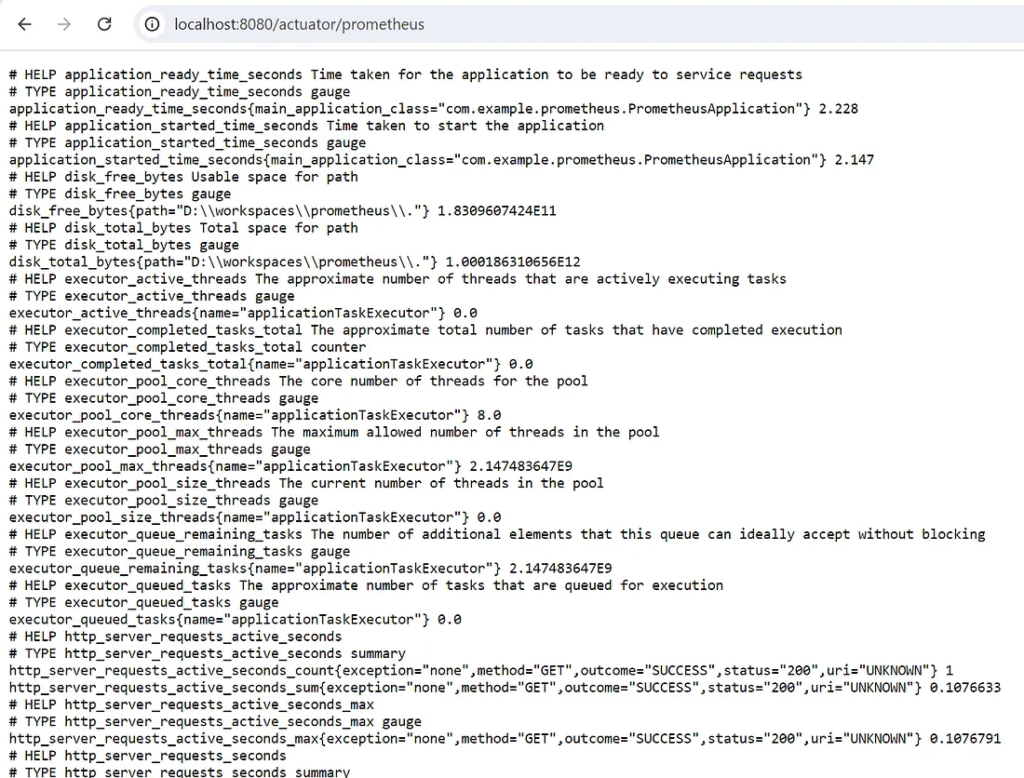
The application shows metrics in Prometheus format, which is ready to send the data when Prometheus requests it.
Spring Boot Actuator with Spring Security.
The developer can use Spring Security to secure exposed metrics from the Spring Boot actuator.
1. Add dependency.
<dependency>
   <groupId>org.springframework.boot</groupId>
   <artifactId>spring-boot-starter-security</artifactId>
</dependency>
2. Create a configuration class.
import org.springframework.context.annotation.Bean;
import org.springframework.context.annotation.Configuration;
import org.springframework.security.config.Customizer;
import org.springframework.security.config.annotation.web.builders.HttpSecurity;
import org.springframework.security.config.annotation.web.configuration.EnableWebSecurity;
import org.springframework.security.web.SecurityFilterChain;

@Configuration
@EnableWebSecurity
public class SecurityConfig {
    @Bean
    public SecurityFilterChain securityFilterChain(HttpSecurity http) throws Exception {
        http
                .authorizeRequests(authorizeRequests ->
                        authorizeRequests
                                .requestMatchers("/actuator/**").hasRole("ACTUATOR")
                                .anyRequest().authenticated()
                )
                .httpBasic(Customizer.withDefaults());
        return http.build();
    }
}
3. Create a username and password in the application.properties file.
# Spring Security - In-memory user details
spring.security.user.name=actuatorUser
spring.security.user.password=actuatorPassword
spring.security.user.roles=ACTUATOR
4. An alternative is using YAML as an application configuration.
spring:
  security:
    user:
      name: actuatorUser
      password: actuatorPassword
      roles: ACTUATOR
Access the Spring Boot actuator with username and password.
The actuator requires a username and password.
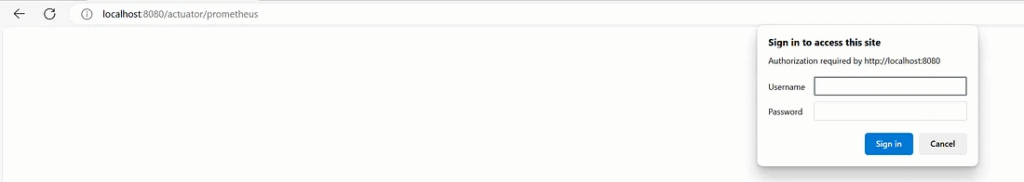
When the developer inputs a username and password to grant access to the actuator.
Deploy multiple instances of the Spring Boot application with Docker.
The developer can deploy a Spring Boot application replica on Docker.
1. Directory structure.
my-spring-boot-app/
├── Dockerfile
├── docker-compose.yml
├── .env
├── pom.xml
├── src/
│   ├── main/
│   │   ├── java/
│   │   │   └── com/
│   │   │       └── example/
│   │   │           └── demo/
│   │   │               └── DemoApplication.java
│   │   ├── resources/
│   │       ├── application.properties
│   │       └── static/
│   │           └── ...
└── target/
    └── my-spring-boot-app.jar
2. Create a Dockerfile.
# Stage 1: Build the JAR file
FROM maven:3.9.7-amazoncorretto-21 AS build
WORKDIR /app
COPY pom.xml .
COPY src ./src
RUN mvn clean package -DskipTests

# Stage 2: Run the application
FROM amazoncorretto:21-alpine
VOLUME /tmp
EXPOSE 8080
COPY --from=build /app/target/*.jar app.jar
ENTRYPOINT ["java", "-jar", "/app.jar"]
3. Create Docker Compose.
services:
  myapp:
    image: myapp:1.0.0
    build:
      context: .
      dockerfile: Dockerfile
    ports:
      - "8080"
    deploy:
      mode: replicated
      replicas: 3
      restart_policy:
        condition: on-failure
    environment:
      - SPRING_SECURITY_USER_NAME=admin
      - SPRING_SECURITY_USER_PASSWORD=admin1234
      - SPRING_SECURITY_USER_ROLES=ACTUATOR
    networks:
      - prometheus-grafana_monitoring
networks:
  prometheus-grafana_monitoring:
    external: true
How is the external network name generated?
The developer can check the Docker network with the docker command in the network attribute.
>docker network ls
In the network name, follow the name generated by the directory structure.
promethus-grafana/
├── docker-compose.yml
networks:
  monitoring:
    driver: bridge
When the developer puts the network configuration inside the directory, the network name from Docker will be generated asprometheus-grafana_monitoring. Pattern directory name with underscore name subset the network attribute in the docker-compose file.
The developer can check the network name using the Docker command.
>docker network ls
NETWORK ID     NAME                            DRIVER    SCOPE
179ff0de1c86   bridge                          bridge    local
90e23212ded7   host                            host      local
61218b2c7675   none                            null      local
780eef27ec97   prometheus-grafana_monitoring   bridge    local
Execute the Docker command to build an image and start the server.
>docker compose -d
Detached Mode (-d): This option allows you to run Docker containers in the background so you can continue using the terminal for other commands. It’s useful for running services that don’t need interactive user input or starting multiple services without blocking your terminal.
Check the Docker container.
>docker container ls
CONTAINER ID   IMAGE                    COMMAND                  CREATED          STATUS          PORTS                           NAMES
6d4724bc53fa   myapp:1.0.0              "java -jar /app.jar"     12 minutes ago   Up 12 minutes   0.0.0.0:58804->8080/tcp         prometheus-myapp-1
c9d276e364ac   myapp:1.0.0              "java -jar /app.jar"     12 minutes ago   Up 12 minutes   0.0.0.0:58805->8080/tcp         prometheus-myapp-3
05a7210be4fe   myapp:1.0.0              "java -jar /app.jar"     12 minutes ago   Up 12 minutes   0.0.0.0:58806->8080/tcp         prometheus-myapp-2
Check the alias name of the application on Docker.
The developer can view the alias name of each application replica using the Docker command.
>docker inspect prometheus-myapp-1
 "Networks": {
    "prometheus-grafana_monitoring": {
        "IPAMConfig": null,
        "Links": null,
        "Aliases": [
            "prometheus-myapp-1",
            "myapp"
        ],
        "MacAddress": "02:42:ac:12:00:04",
        "DriverOpts": null,
        "NetworkID": "780eef27ec97e10e9b066add8eb1e584d68da3b15cd66d25b27e144434d0d734",
        "EndpointID": "3eb5ac30deef4ba82706358672596c578d416a52fb15135e56d9a41e949a87d4",
        "Gateway": "172.18.0.1",
        "IPAddress": "172.18.0.4",
        "IPPrefixLen": 16,
        "IPv6Gateway": "",
        "GlobalIPv6Address": "",
        "GlobalIPv6PrefixLen": 0,
        "DNSNames": [
            "prometheus-myapp-1",
            "myapp",
            "6d4724bc53fa"
        ]
    }
}
Create a Prometheus server on Docker.
Directory Structure
/prometheus-grafana
├── docker-compose.yml
├── prometheus.yml
In the docker-compose.yml file. The file contains the configuration of the Prometheus and Grafana servers.
services:
  prometheus:
    image: prom/prometheus:latest
    container_name: prometheus
    volumes:
      - ./prometheus.yml:/etc/prometheus/prometheus.yml
    ports:
      - "9090:9090"
    networks:
      - monitoring

volumes:
  grafana-storage:
networks:
  monitoring:
    driver: bridge
In the prometheus.yml file. The file contains the configuration to pull the data from the client.
global:
  scrape_interval: 15s

scrape_configs:
  - job_name: 'monitoring'
    static_configs:
      - targets: ['localhost:8080']
    metrics_path: /actuator/prometheus
Execute the Docker command to pull an image and start the server.
docker-compose up -d
Access the Prometheus server.
The developer can monitor an application from Prometheus via
“http://localhost:9090/”.
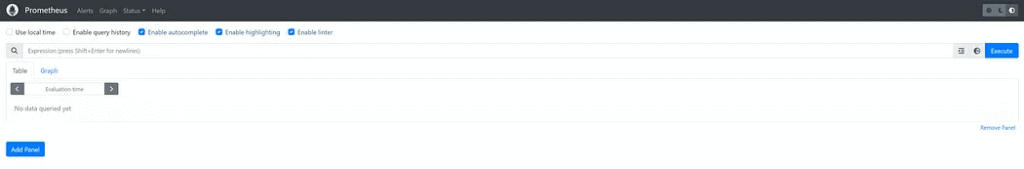
Check the server health on Prometheus.
Check the health of each instance server by using Prometheus instead of checking individual instances through the actuator.
Configuration in Prometheus.
global:
  scrape_interval: 30s

scrape_configs:
  - job_name: 'prometheus'
    static_configs:
      - targets: ['prometheus-myapp-1:8080','prometheus-myapp-2:8080','prometheus-myapp-3:8080']
    metrics_path: /actuator/prometheus
    basic_auth:
      username: 'admin'
      password: 'admin1234'
Using path “http://localhost:9090/targets”.
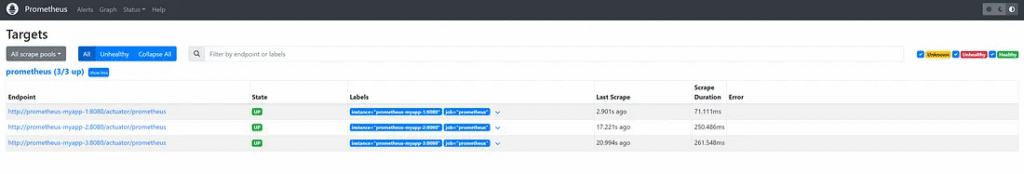
The instance that registered the endpoint in “prometheus.yml” is shown on the Endpoint table.
Finally
Integrate the Spring Boot actuator with Prometheus or other tools that make an application easy to maintain.
The developer should learn how to configure the exposed metric.
The developer can configure the application properties file to disable or enable specific metrics, which helps the application avoid unnecessary metrics.


