
Elasticsearch monitors, logs, collects, and analyses text data. The developer can use Elasticsearch to collect logs from the Spring Boot application with Logstash, which helps the developer improve the performance of tracing and analyzing logs. Elasticsearch can integrate Kibana to view the log data in the visualizer. Kibana supports monitoring and observability.
Elasticsearch has an alternative tool, like Grafana Loki, that supports Logback and monitoring and tracing logs. The developer must consider which one is suitable for the project.
What is the difference between Elasticsearch and Grafana Loki?
Purpose
Grafana Loki: Log aggregation and analysis.
Elasticsearch: Search and analytics engine.
Architecture
Grafana Loki: Indexes metadata only.
Elasticsearch: Indexes the content of documents.
Query Language
Grafana Loki: LogQL.
Elasticsearch: Query DSL.
Integration
Grafana Loki: Integrates with Grafana.
Elasticsearch: Integrates with Elastic Stack and Kibana.
Storage
Grafana Loki: Efficient log storage and compressed logs.
Elasticsearch: Handles diverse data types, Not Compressed logs.
Use Cases
Grafana Loki: Log management.
Elasticsearch: Log management, search, analytics.
Performance
Grafana Loki: Faster for log queries.
Elasticsearch: Resource-intensive and slower than Grafana Loki, but powerful.
Cost
Grafana Loki: Lower cost for log storage.
Elasticsearch: Potentially higher costs.
Summary
Both can be used for Log management. Elasticsearch supports a wide range of features, such as full-text searching, because log data and analytic data are not compressed. However, Elasticsearch is complex and consumes a lot of resources.
Grafana Loki is lightweight, but it lacks some features. The developer must decide which suits the project based on the requirements.
Install Elasticsearch, Kibana, and Logstash.

1. Directory structure.
monitoring/
├── elasticsearch/
│   ├── elasticsearch.yml (optional)
├── logstash/
│   ├── logstash.conf
├── kibana/
│   ├── kibana.yml (optional)
└── docker-compose.yml
2. Create a Docker Compose file named docker-compose.yml.
version: '3.9'
services:
  elasticsearch:
    image: docker.elastic.co/elasticsearch/elasticsearch:7.17.22
    container_name: elasticsearch
    environment:
      - node.name=elasticsearch
      - cluster.name=docker-cluster
      - discovery.type=single-node
      - bootstrap.memory_lock=true
      - "ES_JAVA_OPTS=-Xms512m -Xmx512m"
    ulimits:
      memlock:
        soft: -1
        hard: -1
    volumes:
      - es_data:/usr/share/elasticsearch/data
    ports:
      - 9200:9200
    networks:
      - my-network
  kibana:
    image: docker.elastic.co/kibana/kibana:7.17.22
    container_name: kibana
    environment:
      - ELASTICSEARCH_HOSTS=http://elasticsearch:9200
    ports:
      - 5601:5601
    networks:
      - my-network
  logstash:
    image: docker.elastic.co/logstash/logstash:7.17.22
    container_name: logstash
    volumes:
      - ./logstash/logstash.conf:/usr/share/logstash/pipeline/logstash.conf
    ports:
      - 5000:5000
      - 9600:9600
    networks:
      - my-network
    depends_on:
      - elasticsearch
volumes:
  es_data:
    driver: local
networks:
  my-network:
driver: bridge3. Create Logstash configuration file logstash.conf.
input {
  tcp {
    port => 5000
    codec => json_lines
  }
}

output {
  elasticsearch {
    hosts => ["http://elasticsearch:9200"]
    index => "logback-%{+YYYY.MM.dd}"
  }
  stdout { codec => rubydebug }
}4. Run docker-compose.
>docker compose up
5. Check images on Docker.
REPOSITORY                                      TAG       IMAGE ID       CREATED        SIZE
docker.elastic.co/elasticsearch/elasticsearch   7.17.22   a0d1e060e05d   3 weeks ago    634MB
docker.elastic.co/kibana/kibana                 7.17.22   dd9c92b94315   3 weeks ago    906MB
docker.elastic.co/logstash/logstash             7.17.22   754beee29bc7   2 months ago   787MB
6. Check containers on Docker.
>docker container ls
CONTAINER ID   IMAGE                                                   COMMAND                  CREATED        STATUS          PORTS                                                      NAMES
7ce4d15e9065   docker.elastic.co/logstash/logstash:7.17.22             "/usr/local/bin/dock…"   47 hours ago   Up 20 seconds   0.0.0.0:5000->5000/tcp, 0.0.0.0:9600->9600/tcp, 5044/tcp   logstash
81fcf73ab00c   docker.elastic.co/elasticsearch/elasticsearch:7.17.22   "/bin/tini -- /usr/l…"   47 hours ago   Up 20 seconds   0.0.0.0:9200->9200/tcp, 9300/tcp                           elasticsearch
88aaf7751a24   docker.elastic.co/kibana/kibana:7.17.22                 "/bin/tini -- /usr/l…"   47 hours ago   Up 20 seconds   0.0.0.0:5601->5601/tcp                                     kibana
7. Elasticsearch, Kibana, and Logstash are ready.
Configure a Spring Boot application.
1. Create RestController.
import lombok.extern.slf4j.Slf4j;
import org.springframework.beans.factory.annotation.Autowired;
import org.springframework.http.HttpStatus;
import org.springframework.http.ResponseEntity;
import org.springframework.web.bind.annotation.GetMapping;
import org.springframework.web.bind.annotation.PathVariable;
import org.springframework.web.bind.annotation.RequestMapping;
import org.springframework.web.bind.annotation.RestController;

@RestController
@RequestMapping("/api/products")
@Slf4j
public class ProductsController {


    @Autowired
    public ProductsController(ProductServiceInf productServiceInf){
        this.productServiceInf = productServiceInf;
    }


    @GetMapping(path = "/{productId}", produces = "application/json")
    public ResponseEntity<Object> getUserprofile(@PathVariable String productId) {
        log.info("Example  info  message -> Received product ID {}", productId);
        log.debug("Example debug message -> Received product ID {}", productId);
        log.error("Example error message -> not found product ID {}", productId);
        return new ResponseEntity<>(null, HttpStatus.OK);
    }

}
2. Configuration Logback to connect with Logstash in a “logback-spring.xml” file.
<?xml version="1.0" encoding="UTF-8"?>
<configuration>

    <appender name="STDOUT" class="ch.qos.logback.core.ConsoleAppender">
        <encoder>
            <pattern>%d{yyyy-MM-dd HH:mm:ss} [%thread] %-5level %logger{36} - %msg traceId=%X{traceId} spanId=%X{spanId}%n</pattern>
        </encoder>
    </appender>

    <!-- Logstash Appender for sending logs to Logstash-->
    <appender name="LOGSTASH" class="net.logstash.logback.appender.LogstashTcpSocketAppender">
        <!-- Logstash host and port -->
        <destination>localhost:5000</destination>
        <encoder class="net.logstash.logback.encoder.LogstashEncoder"/>
    </appender>

    <root level="info">
        <appender-ref ref="STDOUT"/>
        <appender-ref ref="LOGSTASH"/>
    </root>

</configuration>
3. Start the Spring Boot application.
  .   ____          _            __ _ _
 /\\ / ___'_ __ _ _(_)_ __  __ _ \ \ \ \
( ( )\___ | '_ | '_| | '_ \/ _` | \ \ \ \
 \\/  ___)| |_)| | | | | || (_| |  ) ) ) )
  '  |____| .__|_| |_|_| |_\__, | / / / /
 =========|_|==============|___/=/_/_/_/
 :: Spring Boot ::                (v3.2.2)
...
2024-07-03 16:26:28 [restartedMain] INFO  com.example.demo.DemoApplication - Started DemoApplication in 7.866 seconds (process running for 8.639)
4. Test the web service to send logs to Logstash.
>curl http://localhost:8080/api/products/1
5. In the console log.
2024-07-03 16:27:56 [http-nio-8080-exec-1] INFO  c.e.d.c.products.ProductsController - Example  info  message -> Received product ID 1 traceId=6685199c31c95ae5097d44d33f628c58 spanId=0c74e7b1552a486e
2024-07-03 16:27:56 [http-nio-8080-exec-1] ERROR c.e.d.c.products.ProductsController - Example error message -> not found product ID 1 traceId=6685199c31c95ae5097d44d33f628c58 spanId=0c74e7b1552a486e
2024-07-03 16:27:56 [http-nio-8080-exec-1] INFO  c.e.demo.services.ProductServiceImpl - get product by ID 1 traceId=6685199c31c95ae5097d44d33f628c58 spanId=0c74e7b1552a486e
Monitoring in Kibana.
1. URL http://localhost:5601 to access Kibana’s home page.
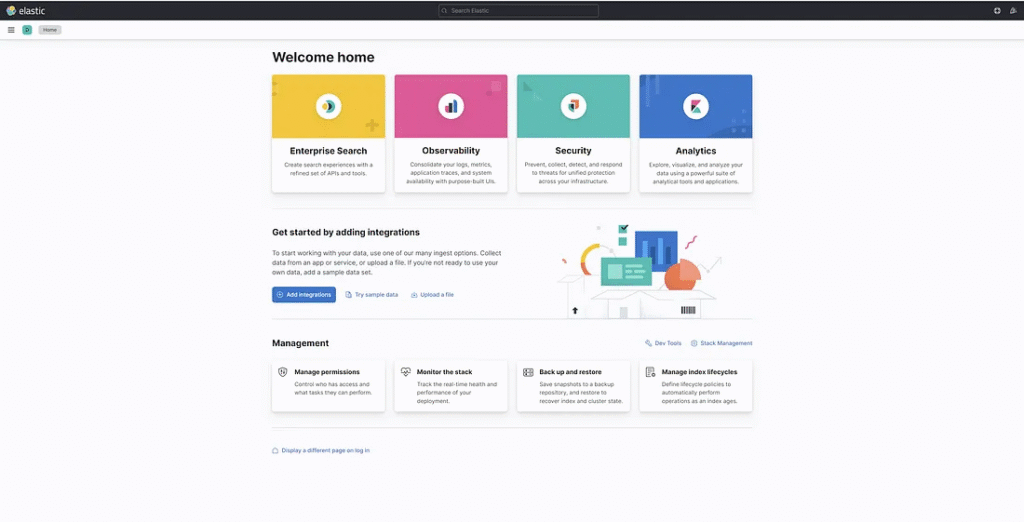
2. On Kibana’s home page, display various features that can be integrated with Kibana.
3. The developer must create a pattern to read logs from Elasticsearch.
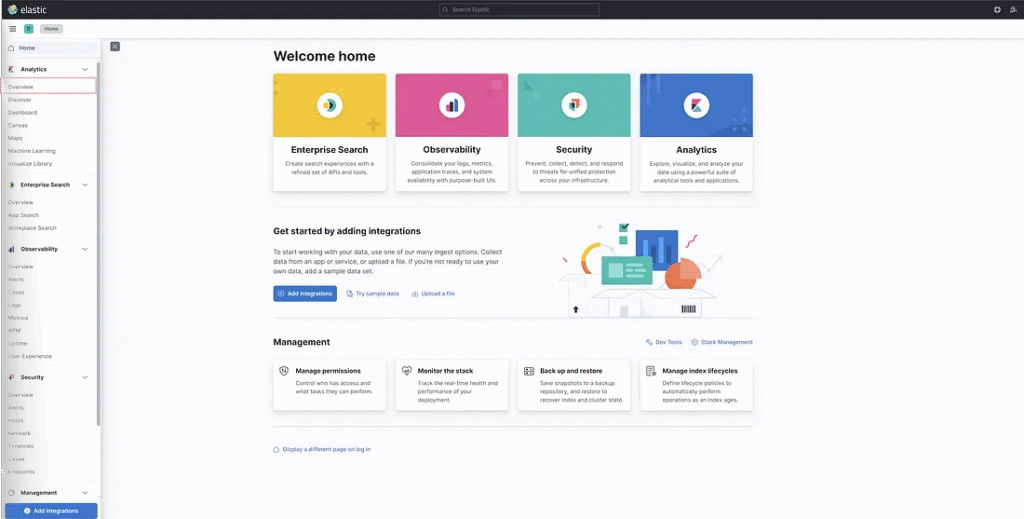
Analytics in Kibana.
1. Choose Overview in the Analytics menu.
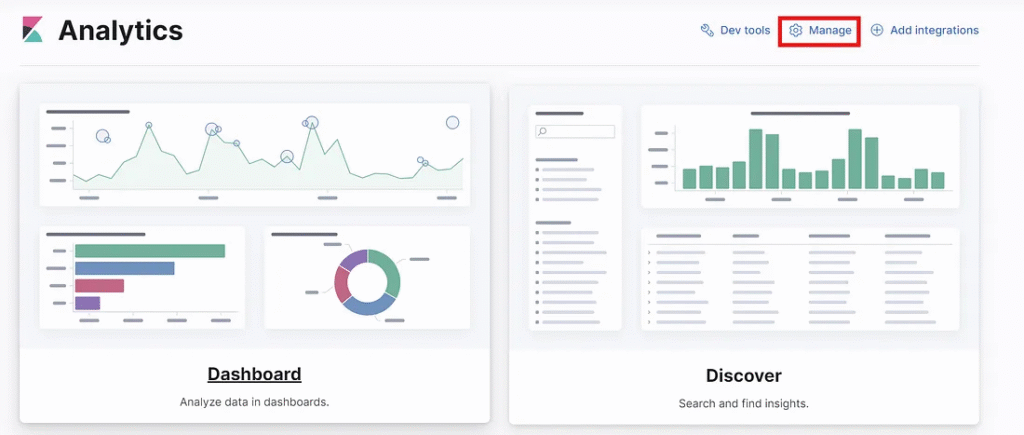
2. Choose the Manage link.
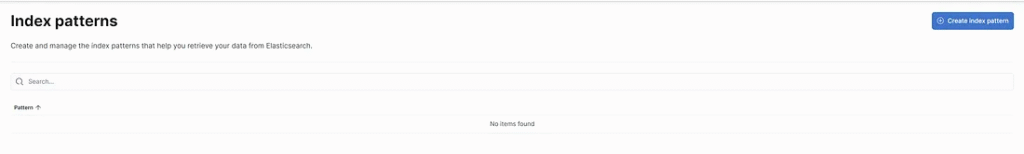
3. Choose Index patterns.
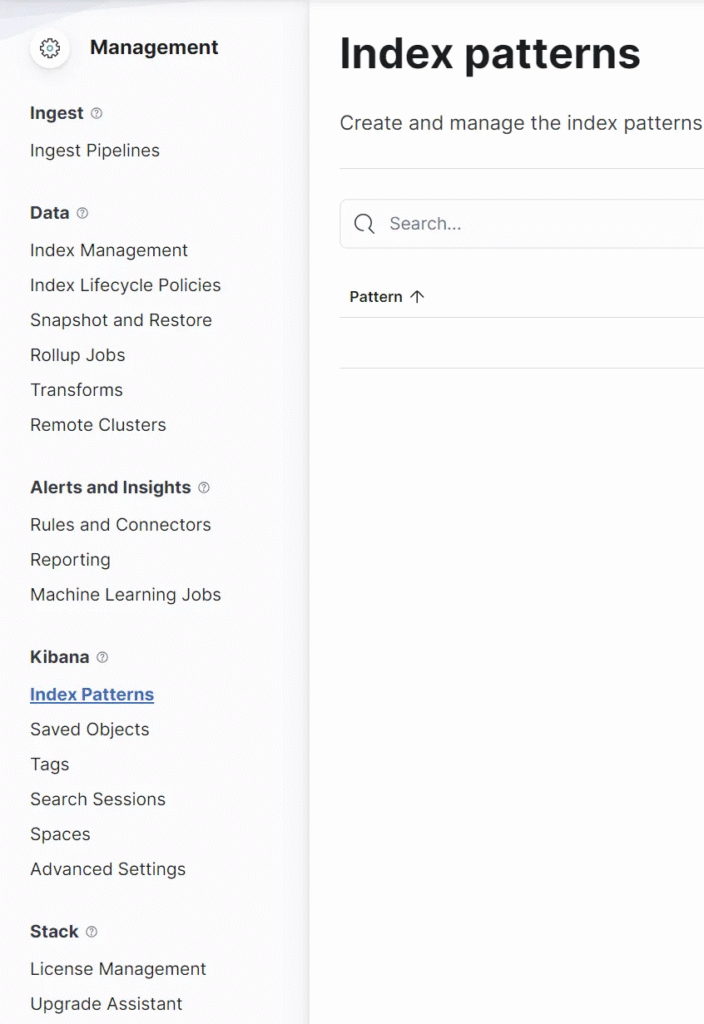
4. Create an index pattern.
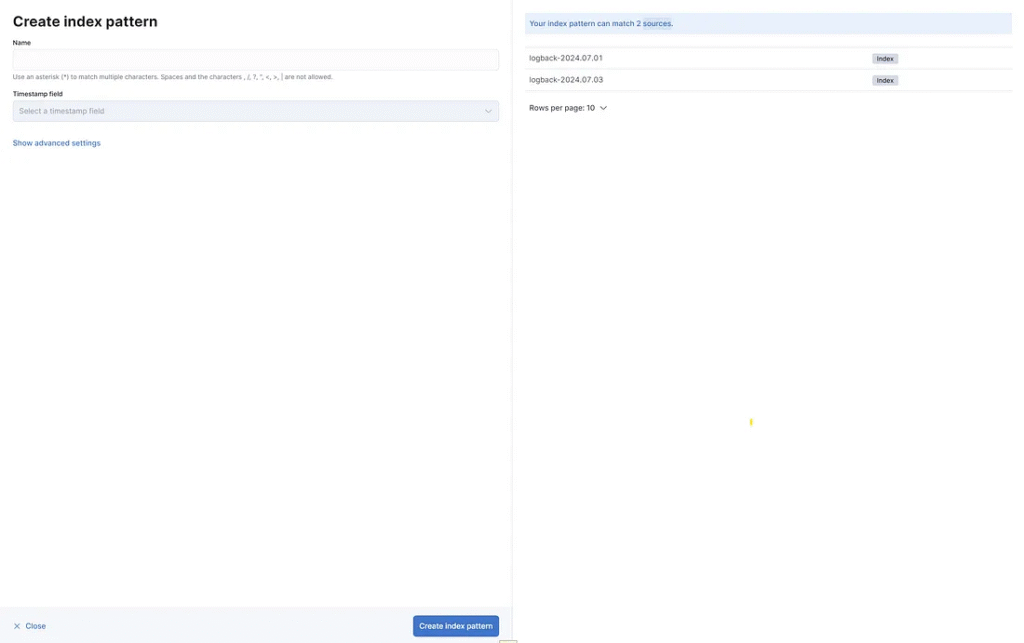
Create an index pattern.
1. When creating an index pattern, the developer adds a name for the sources. The sources are shown on the right side.
2. For example, input name logback-2024.* and Timestamp field is @timestamp
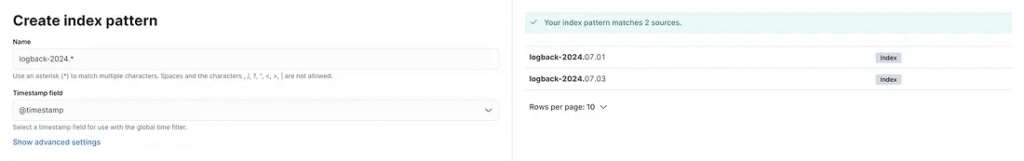
3. The index pattern name is the index pattern that matches two sources.
The developer clicks the Create Index Pattern button.
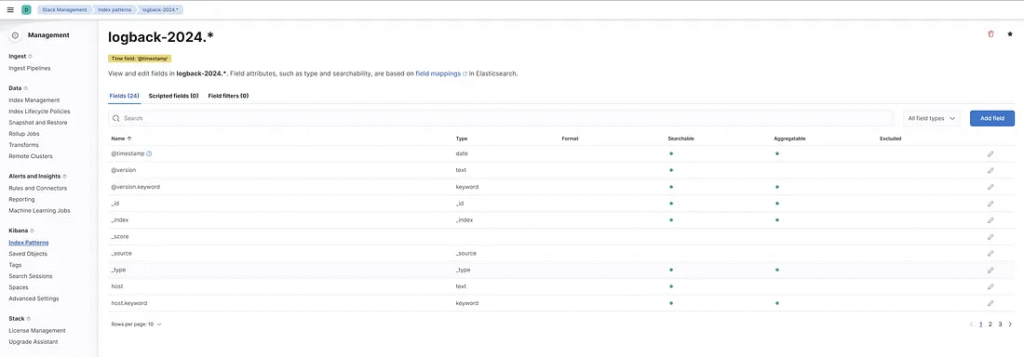
4. Kibana shows information about index patterns.
Discover in the Analytics menu.
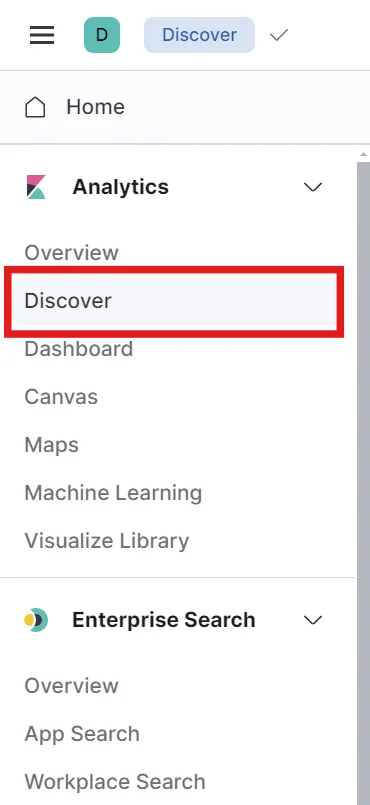
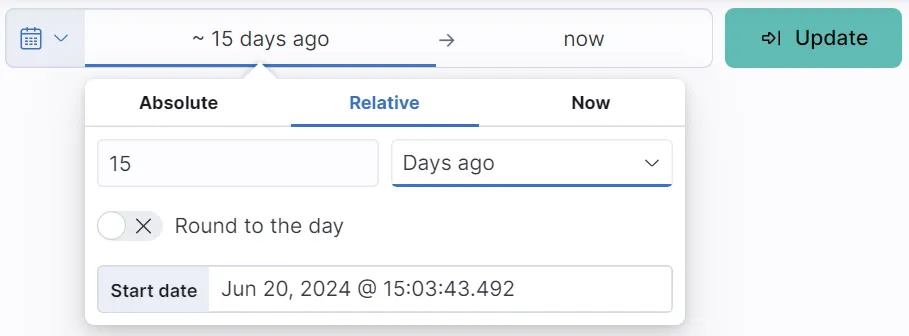
1. Choose the date and time to view logs.
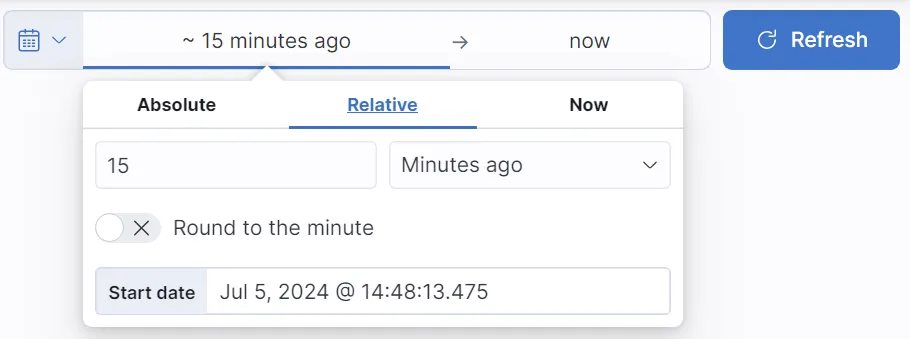
2. Click the “Update” button to view the logs.
3. Discover and show log details and information.
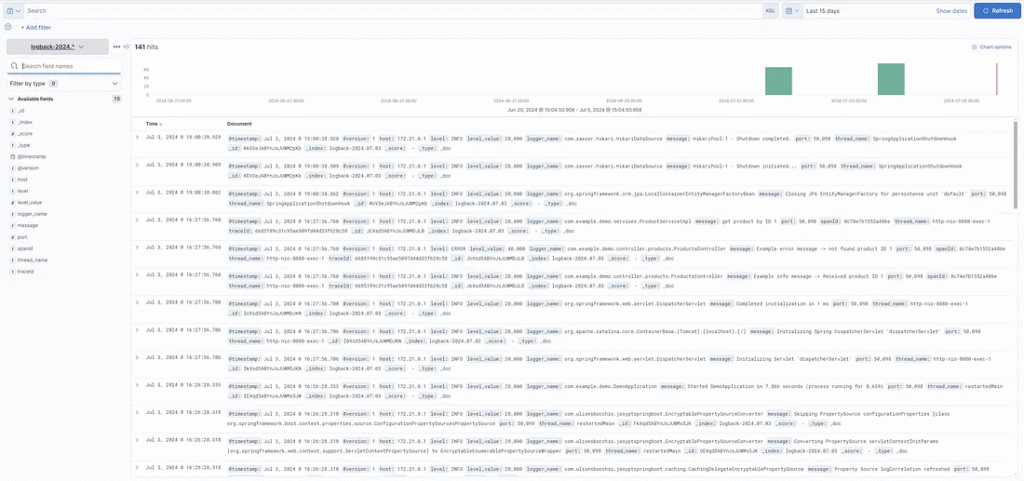
4. In addition to Discovery, developers can search using the Kibana Query Language (KQL).
Example
For example, input “6685199c31c95ae5097d44d33f628c58″. The discovery shows a log that contains text from a search query.
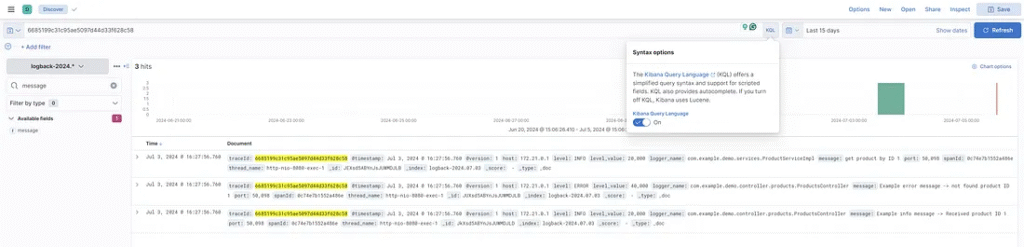
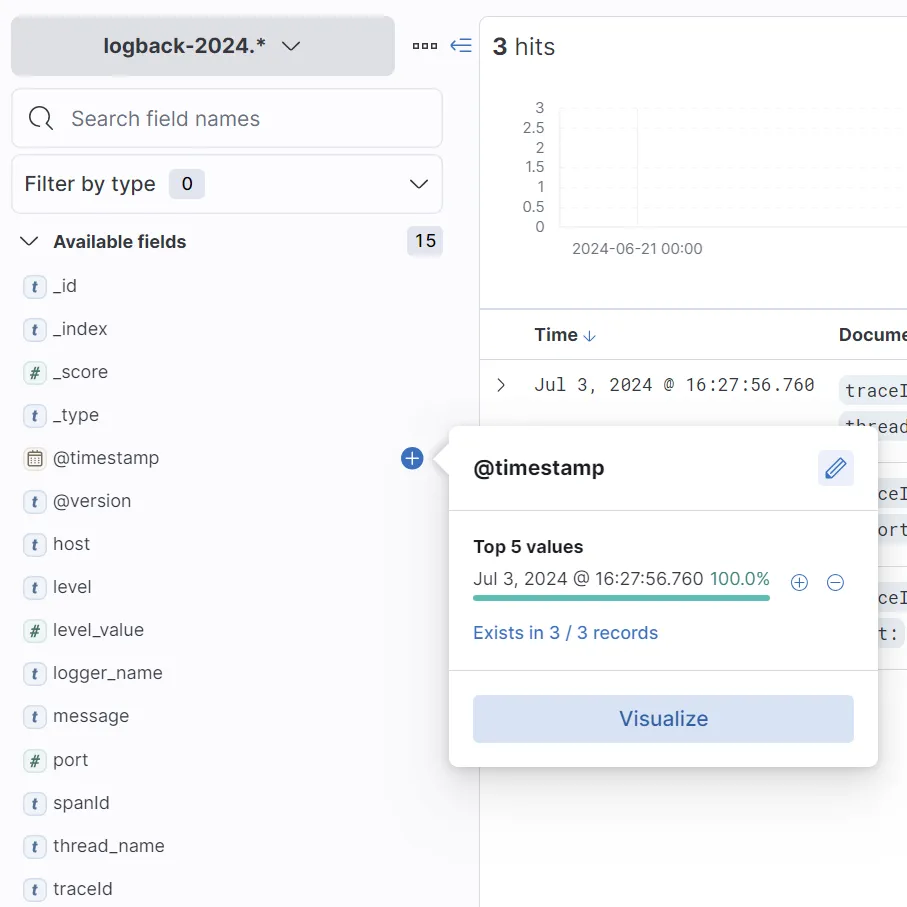
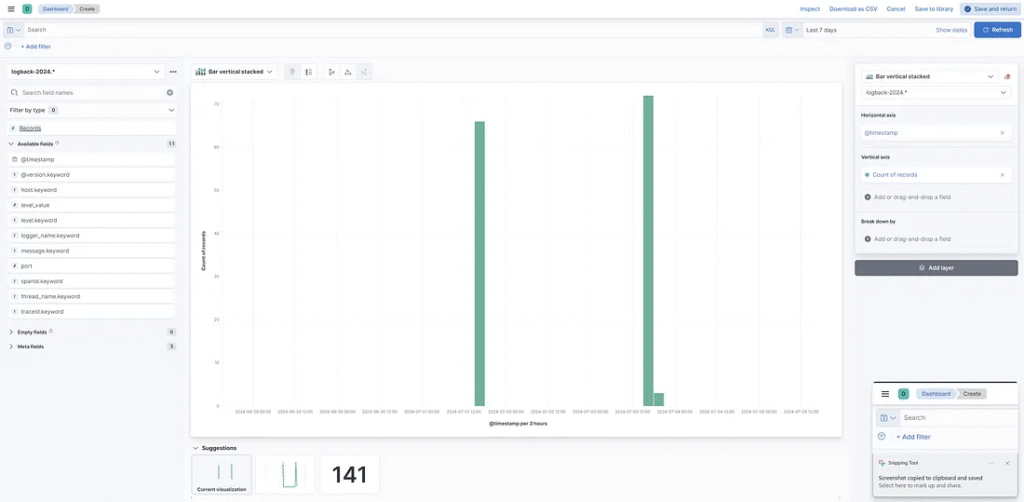
The developer can filter and visualize the data.
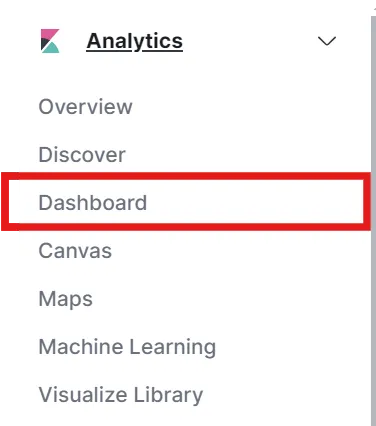
Dashboard in the Analytics menu.
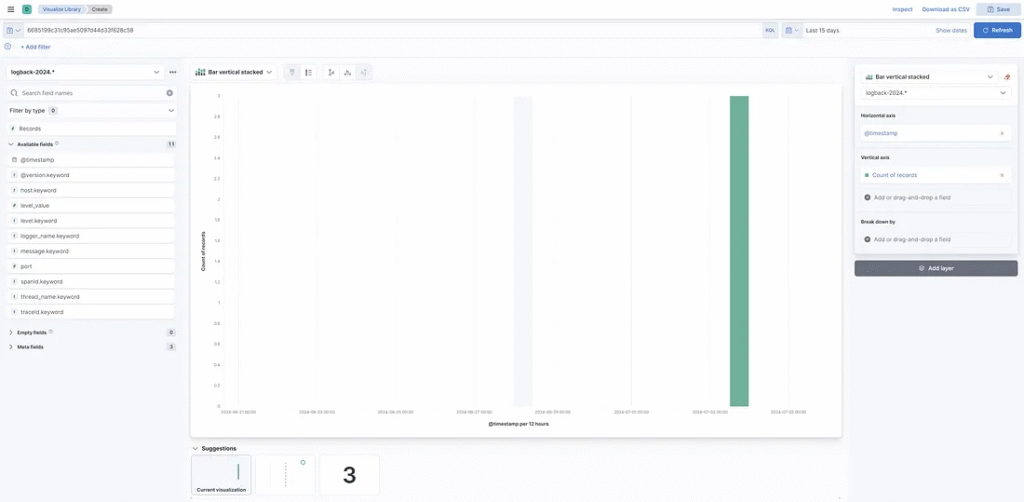
1. The developer can create a dashboard for logs.
2. Create a visualization for display on a dashboard.
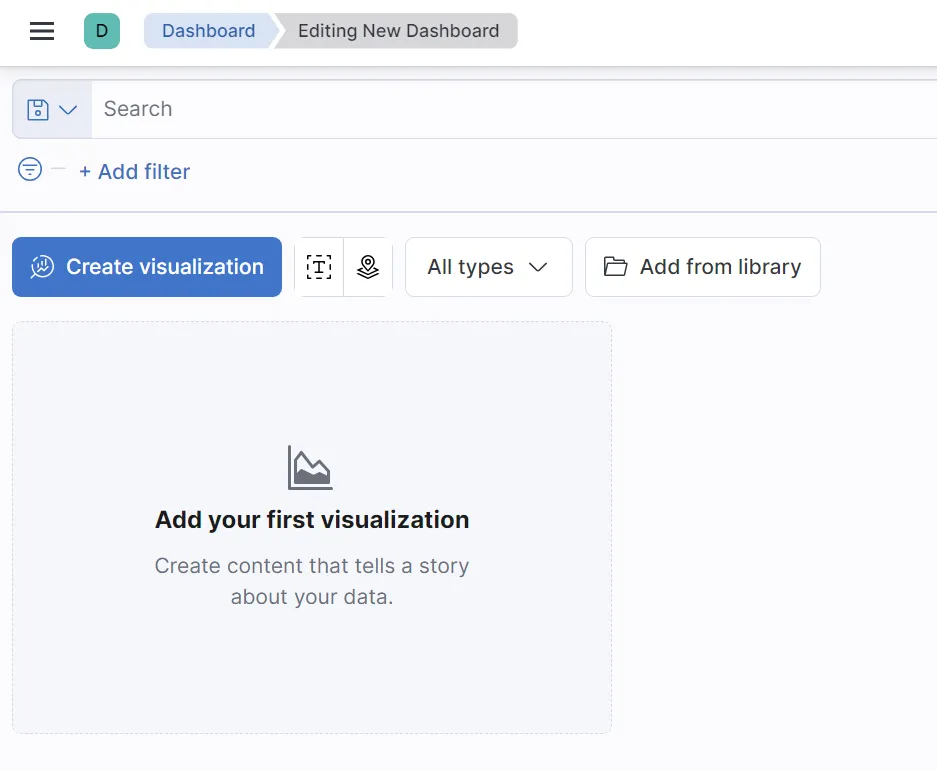
3. The developer can show the information. The developer can choose which fields to display on a dashboard.
Conclusion
Kibana supports Elasticsearch and provides various organizations with Analytics, Discover, and Dashboard tools.
Finally
This feature is a simple aspect of Elasticsearch that developers can use to make it similar to Elasticsearch, Logstash, and Kibana.
Elasticsearch is just a part of Kibana. Kibana can integrate various tools, making it a powerful tool for monitoring an application. The developer should learn more tools that support Kibana.
To use tools and integrate them with Kibana, apply them to enterprise projects.


