
Discover how to optimize Spring Boot 3 apps using JavaMelody. Learn from real-world case studies and expert tips. Boost your app’s performance today!
In the ever-evolving landscape of software development, where applications are becoming increasingly complex and user expectations are soaring, ensuring optimal performance is paramount. Sluggish response times, inefficient resource utilization, and unforeseen bottlenecks can severely impact user experience and hinder the success of even the most well-designed applications. This is where performance monitoring tools like JavaMelody come into play, offering developers a comprehensive suite of capabilities to identify and address performance issues proactively.

Introduction to JavaMelody: A Powerful Performance Monitoring Tool
JavaMelody is an open-source monitoring solution that provides real-time insights into the performance of Java-based applications, including those built on the widely adopted Spring Boot framework. With its extensive features and seamless integration, JavaMelody empowers developers to optimize their applications, ensuring they deliver a smooth and responsive user experience while efficiently utilizing system resources.
Seamless Integration with Spring Boot 3
One of JavaMelody’s key advantages is its seamless integration with Spring Boot 3, a popular and robust framework for building scalable and maintainable applications. By leveraging the JavaMelody Spring Boot Starter, developers can effortlessly incorporate performance monitoring capabilities into their Spring Boot projects, streamlining the development process and enabling them to focus on core application logic.
Adding the JavaMelody Dependency
To integrate JavaMelody into a Spring Boot 3 application, developers must include the appropriate dependency in their project’s build configuration file (e.g., pom.xml for Maven or build. gradle for Gradle). Here’s an example of how to add the JavaMelody Spring Boot Starter dependency using Maven:
<dependency>
    <groupId>net.bull.javamelody</groupId>
    <artifactId>javamelody-spring-boot-starter</artifactId>
    <version>2.2.0</version>
</dependency>
Once the dependency is added, JavaMelody will automatically configure and monitor the application upon startup.
Accessing the JavaMelody Monitoring Interface
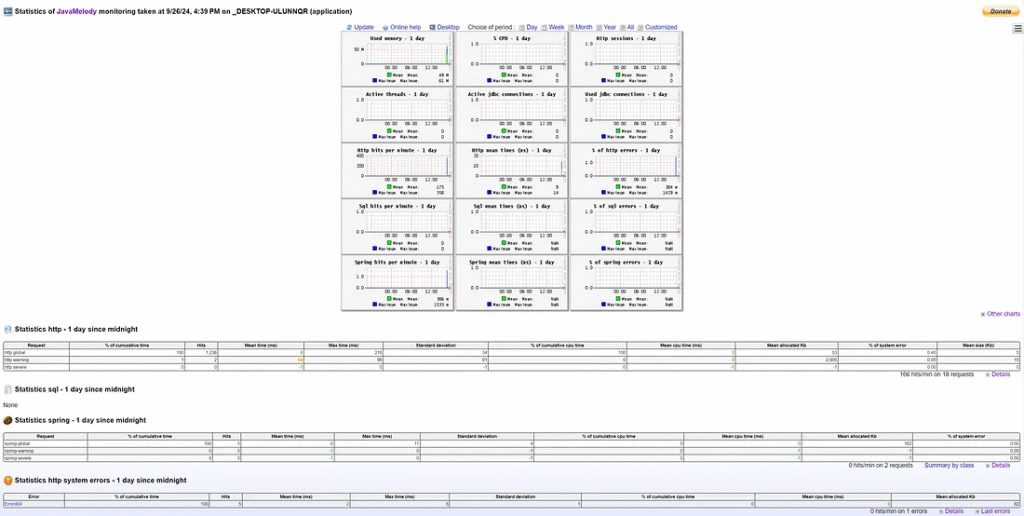
After successfully integrating JavaMelody, developers can access its monitoring interface by navigating to the /monitoring endpoint in their application. For example, if the application runs locally on port 8080, the JavaMelody monitoring interface can be accessed via
http://localhost:8080/monitoring
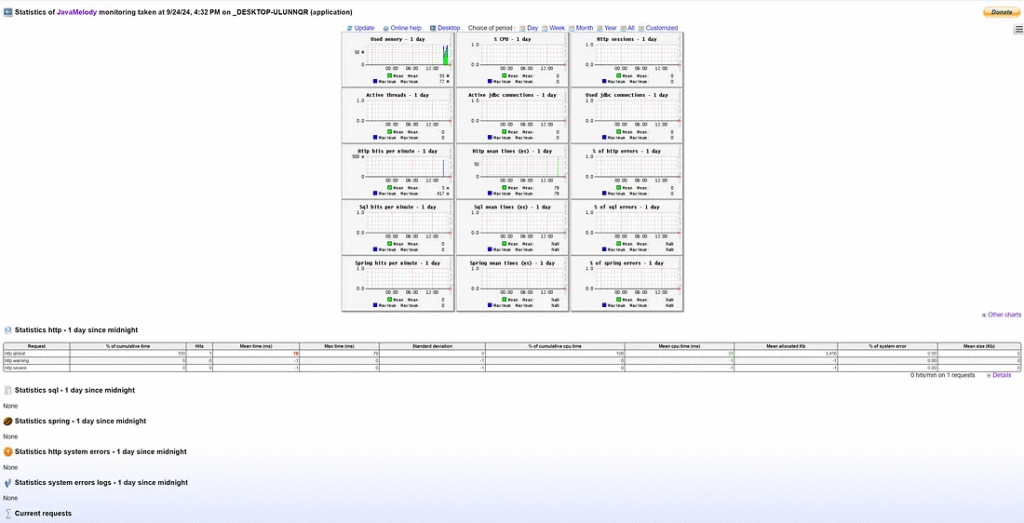
The monitoring interface provides a comprehensive overview of the application’s performance, including metrics such as CPU usage, memory utilization, request and response times, and database query performance. This real-time data empowers developers to identify potential bottlenecks, optimize resource utilization, and ensure their applications deliver optimal performance.
Configuring JavaMelody for Optimal Performance Monitoring
While JavaMelody’s default configuration suits most use cases, developers can fine-tune its behavior to better align with their specific requirements. This can be achieved by leveraging Spring Boot’s configuration properties, which allow for easy customization of various JavaMelody settings.
Example configuration
javamelody:
  enabled: true
  url-mapping: /monitoring
  storage-directory: /tmp/javamelody
  system-actions-enabled: true
  monitoring-path: /monitoring
Excluding Data Sources from Monitoring
In certain scenarios, developers may want to exclude specific data sources from being monitored by JavaMelody. This can be accomplished by specifying the excluded-datasources property in the application’s configuration file. For example:
javamelody:
  excluded-datasources: secretSource,topSecretSource
This configuration will instruct JavaMelody to exclude the data sources named secretSource and topSecretSource from monitoring.
Enabling or Disabling Spring Monitoring
JavaMelody provides the capability to monitor Spring services and controllers out of the box. However, developers can enable or disable this feature using the spring-monitoring-enabled property. For example:
javamelody:
  spring-monitoring-enabled: false
Setting this property false will disable the monitoring of Spring services and controllers.
Customizing JavaMelody Initialization Parameters
JavaMelody offers a wide range of initialization parameters that allow developers to tailor its behavior to their needs. These parameters can be specified using the init-parameters property in the application’s configuration file. Here are a few examples:
javamelody:
  init-parameters:
    log: true # Log HTTP requests
    url-exclude-pattern: (/webjars/.*|/css/.*|/images/.*|/fonts/.*|/js/.*) # Exclude specific URL patterns from monitoring
    http-transform-pattern: \d+ # Aggregate digits in HTTP requests
    authorized-users: admin:pwd # Set basic authentication for the monitoring interface
    storage-directory: /tmp/javamelody # Change the default storage directory
    monitoring-path: /admin/performance # Change the default monitoring path
These initialization parameters can be adjusted to suit the specific requirements of the application, such as enabling request logging, excluding specific URL patterns from monitoring, aggregating digits in HTTP requests, securing the monitoring interface with basic authentication, and changing the storage directory or monitoring path.
Securing the JavaMelody Monitoring Interface
While JavaMelody’s monitoring interface provides valuable insights into an application’s performance, it’s crucial to ensure that access to this sensitive information is appropriately secured. JavaMelody offers several options to achieve this, including IP address restrictions and basic authentication.
Restricting Access by IP Address
One way to secure the JavaMelody monitoring interface is to restrict access based on IP addresses. This can be accomplished using the allowed-addr-pattern initialization parameter, which accepts a regular expression pattern matching the allowed IP addresses. For example:
javamelody:
  init-parameters:
    allowed-addr-pattern: 192\.168\.1\.\d{1,3} # Allow access only from the 192.168.1.0/24 subnet
In this example, only IP addresses within the 192.168.1.0/24 Subnet will be granted access to the JavaMelody monitoring interface, preventing unauthorized users from accessing JavaMelody monitoring.
Enabling Basic Authentication
Another option for securing the monitoring interface is to enable basic authentication. This can be achieved by specifying the authorized-users initialization parameter, which accepts a comma-separated list of username: password pairs. For example:
javamelody:
  init-parameters:
    authorized-users: admin:password,user:secret
With this configuration, only users with the credentials admin:password or user:secret can access the JavaMelody monitoring interface.
Alternatively, developers can leverage Spring Security to secure the /monitoring Endpoint. This approach involves configuring Spring Security to require authentication and authorization for accessing the monitoring interface, providing an additional layer of security and integration with existing authentication mechanisms.
Security Configuration (Optional)
If the developer application is secured, you may need to adjust your Spring Security configuration to allow access to the monitoring URL. For example, in SecurityConfig:
@Override
protected void configure(HttpSecurity http) throws Exception {
    http
        .authorizeRequests()
        .antMatchers("/monitoring/**").permitAll()  // Allow access to the monitoring page
        .anyRequest().authenticated();
}
Advanced JavaMelody Features for Performance Optimization
While JavaMelody’s core functionality revolves around monitoring and reporting, it also offers several advanced features that can further enhance performance optimization efforts.
Profiling and Sampling
JavaMelody offers profiling and sampling capabilities, enabling developers to analyze the execution times of individual methods within their applications. This can be particularly useful for identifying performance bottlenecks and pinpointing areas for optimization.
To enable profiling and sampling, developers can leverage JavaMelody’s initialization parameters. For example:
javamelody:
  init-parameters:
    sampling-seconds: 10 # Enable sampling every 10 seconds
    sampling-included-packages: com.example.myapp # Specify packages to include in sampling
    sampling-excluded-packages: com.example.myapp.util # Specify packages to exclude from sampling
This configuration will allow sampling every 10 seconds for methods within the com.example.myapp while excluding the com.example.myapp.util from sampling.
SQL Query Monitoring
JavaMelody provides detailed monitoring of SQL queries for applications that heavily rely on databases. This feature can help identify slow or inefficient queries, enabling developers to optimize database interactions and improve overall application performance.
JavaMelody automatically captures and logs all executed SQL queries, execution times, and other relevant metadata. This information can be accessed through the monitoring interface, where developers can analyze query performance and identify potential bottlenecks.
Additionally, JavaMelody can transform or exclude specific SQL queries from monitoring using the sql-transform-pattern and url-exclude-pattern initialization parameters, respectively.
Remote Monitoring and Alerting
In addition to its local monitoring capabilities, JavaMelody supports remote monitoring and alerting through integration with popular monitoring tools and services. This feature enables developers to centralize performance monitoring across multiple applications and environments, allowing for the proactive identification and resolution of performance issues.
JavaMelody can be configured to send monitoring data to various destinations, such as:
StatsD: A popular open-source monitoring tool for aggregating and analyzing application metrics.
Graphite: A powerful monitoring tool that provides a scalable and efficient way to store and visualize time-series data.
InfluxDB: A high-performance time-series database designed for monitoring and analytics.

CloudWatch: Amazon Web Services monitoring and observability service.
Datadog: A comprehensive monitoring and analytics platform for cloud applications.
By integrating these tools and services, developers can leverage advanced monitoring and alerting capabilities to identify and address performance issues before they impact end-users proactively.
Monitoring Spring Boot Microservices with JavaMelody
In the era of microservices, where applications are decomposed into smaller, independently deployable services, performance monitoring becomes even more critical. JavaMelody’s capabilities extend seamlessly to Spring Boot microservices, enabling developers to monitor the performance of individual services and gain insights into their interactions.
JavaMelody Admin server with Spring Boot
Developers can monitor Microservices with the Admin server console.
Using Spring Boot Admin Starter Server.
Create an Admin server application.
1. Add Maven dependency.
<dependency>
   <groupId>org.springframework.boot</groupId>
   <artifactId>spring-boot-starter-actuator</artifactId>
</dependency>
<dependency>
   <groupId>org.springframework.boot</groupId>
   <artifactId>spring-boot-starter-web</artifactId>
</dependency>
<dependency>
   <groupId>de.codecentric</groupId>
   <artifactId>spring-boot-admin-starter-server</artifactId>
   <version>3.0.0</version>
</dependency>
2. Developers configure an application.yml file.
server:
  port: 8082

spring:
  application:
    name: admin-server
  boot:
    admin:
      url: http://localhost:8082
3. Access the admin console.
http://localhost:8082/
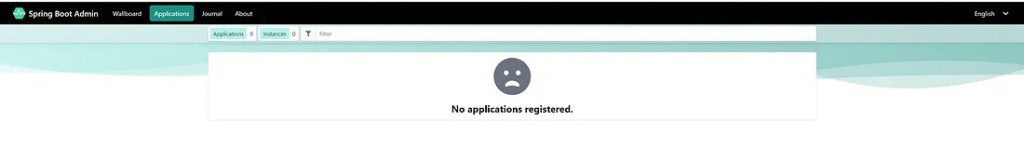
4. In Spring Boot, the console shows that no application has been registered. It waits for the client to connect and send monitoring data to the server.
Create a client application to connect with the admin server.
1. Add a Maven dependency.
<dependency>
   <groupId>org.springframework.boot</groupId>
   <artifactId>spring-boot-starter-actuator</artifactId>
</dependency>
<dependency>
   <groupId>org.springframework.boot</groupId>
   <artifactId>spring-boot-starter-web</artifactId>
</dependency>
<!-- https://mvnrepository.com/artifact/net.bull.javamelody/javamelody-spring-boot-starter -->
<dependency>
   <groupId>net.bull.javamelody</groupId>
   <artifactId>javamelody-spring-boot-starter</artifactId>
   <version>2.2.0</version>
</dependency>
<!-- Spring Boot Admin Client -->
<dependency>
   <groupId>de.codecentric</groupId>
   <artifactId>spring-boot-admin-starter-client</artifactId>
   <version>3.0.0</version>
</dependency>
2. Developers configure an application.yml file.
server:
  port: 8083

spring:
  application:
    name: client-service-1
  boot:
    admin:
      client:
        url: http://localhost:8082 # Point to Admin Server

management:
  endpoints:
    web:
      exposure:
        include: "*"

javamelody:
  enabled: true
3. Access the admin console.
http://localhost:8082/
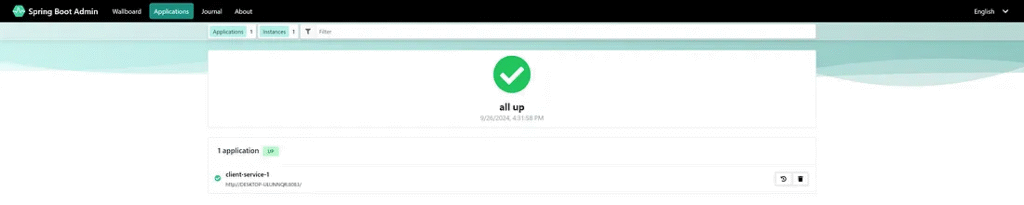
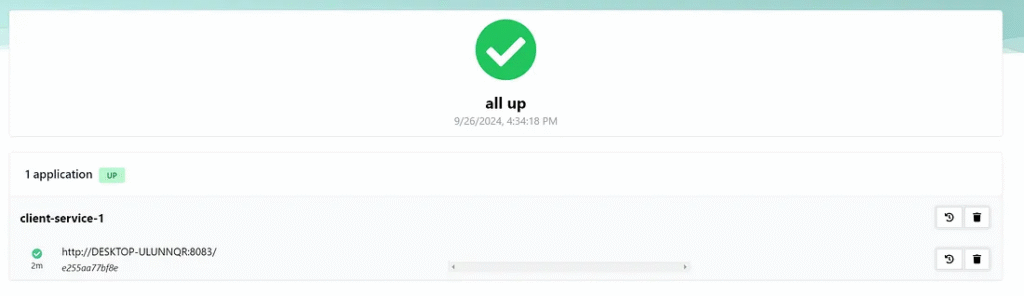
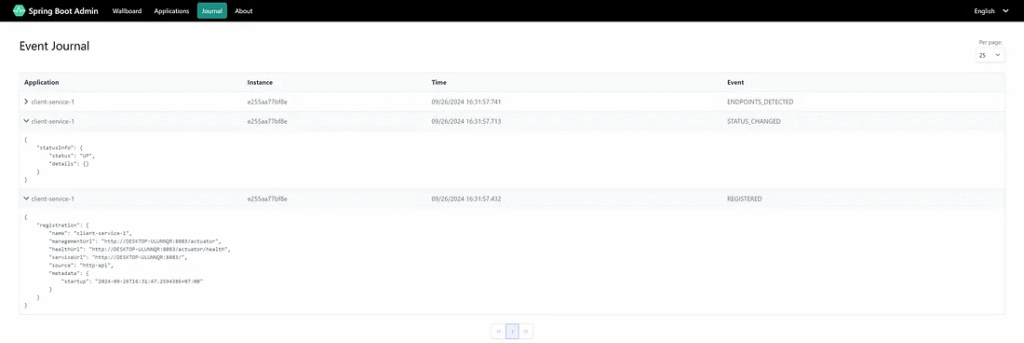
4. On Spring Boot Admin, the admin server found one application client.
View details of a client.
1. Developers can view metrics inside the client by clicking on Client Service 1.
2. Insights information.
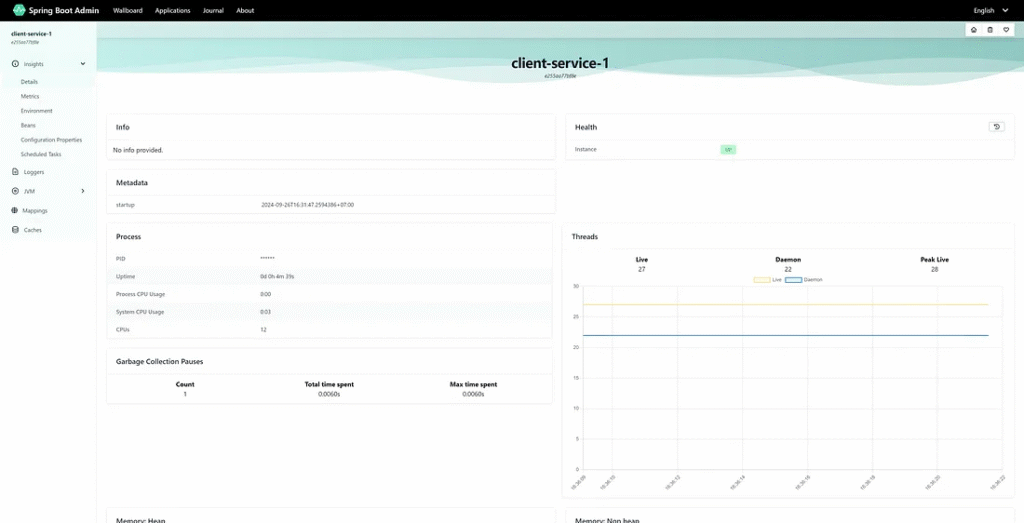
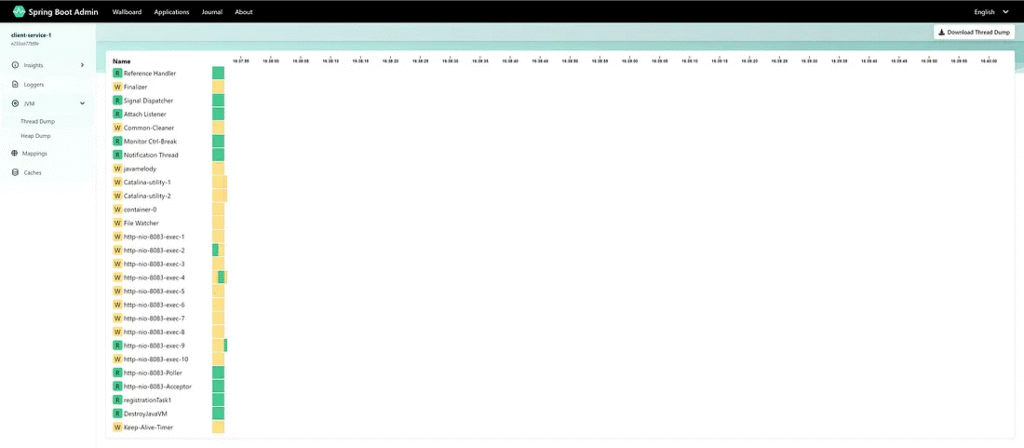
3. JVM information.
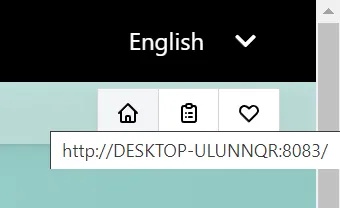
4. Developers can view individual clients by URL for monitoring.
http://localhost:8083/monitoring
Event Journal Information
Conclusion
Developers can add Microservices to the admin server for centralized monitoring with JavaMelody Admin Server. Developers can improve security by using Spring Boot Security.
Spring Boot security prevents unauthorized users from accessing the monitoring server.
Monitoring Inter-Service Communication
One key challenge in microservices architectures is ensuring efficient communication between services. JavaMelody can help developers monitor and optimize inter-service communication by providing detailed insights into request and response times and identifying potential bottlenecks.
For example, if a microservice relies on multiple downstream services to fulfill a request, JavaMelody can help identify which service calls are taking the longest and potentially causing performance issues. With this information, developers can optimize the communication between services, improving overall application performance and responsiveness.
Centralized Monitoring with Remote Monitoring and Alerting
While monitoring individual microservices is valuable, a centralized monitoring approach can provide a more comprehensive view of the system’s performance. JavaMelody’s remote monitoring and alerting capabilities can be leveraged to consolidate performance data from multiple microservices into a centralized monitoring platform.
Developers can gain a unified view of their microservices architecture by integrating with tools like StatsD, Graphite, InfluxDB, CloudWatch, or Datadog. This enables them to identify performance issues across the entire system and proactively address them.
JavaMelody and Performance Engineering Best Practices
While JavaMelody is a powerful tool for monitoring and optimizing application performance, it’s essential to complement its use with established performance engineering best practices. By combining JavaMelody’s insights with industry-standard methodologies, developers can achieve even greater performance gains and ensure the long-term success of their applications.
Load Testing and Benchmarking
Load testing and benchmarking are critical practices in performance engineering. By simulating real-world usage scenarios and subjecting applications to various load conditions, developers can identify potential performance bottlenecks and make informed decisions about optimizing their applications.
JavaMelody can be a valuable ally in load testing and benchmarking efforts. By monitoring application performance during load tests, developers can gain insights into resource utilization, response times, and potential bottlenecks under different load conditions. This information can then be used to fine-tune the application, optimize resource allocation, and ensure optimal performance under expected and peak loads.
Performance Profiling and Code Optimization
While JavaMelody provides valuable insights into application performance, it is often necessary to dive deeper into the codebase to identify and address specific performance issues. This is where performance profiling and code optimization techniques come into play.
Performance profiling tools, such as Java Flight Recorder (JFR) or commercial profilers like YourKit or JProfiler, can be used in conjunction with JavaMelody to analyze the execution times of individual methods, identify hotspots, and pinpoint areas for optimization.
Once performance bottlenecks have been identified, developers can employ various code optimization techniques, such as algorithm improvements, data structure optimizations, caching strategies, and parallelization, to enhance application performance.
Performance Tuning and Resource Management
Effective performance tuning and resource management ensure that applications run efficiently and utilize system resources optimally. JavaMelody can provide valuable insights into resource utilization, enabling developers to make informed decisions about performance tuning and resource allocation.
By monitoring CPU usage, memory consumption, and garbage collection activities, developers can identify potential issues and take appropriate actions, such as adjusting JVM settings, optimizing memory usage, or scaling resources accordingly.
Additionally, JavaMelody’s SQL query monitoring capabilities can help developers identify and optimize database interactions, enhancing application performance and reducing resource consumption.
Continuous Performance Monitoring and Improvement
Performance optimization is an ongoing process that requires continuous monitoring and improvement. As applications evolve and user demands change, it’s essential to maintain a proactive approach to performance monitoring and optimization.
JavaMelody’s real-time monitoring capabilities and integration with remote monitoring and alerting tools enable developers to establish a continuous performance monitoring and improvement cycle. By regularly analyzing performance data, identifying potential issues, and implementing optimizations, developers can ensure that their applications remain performant and responsive even as they grow and evolve.
Conclusion: JavaMelody for High-Performance Spring Boot Applications
In the ever-changing landscape of software development, where performance is a critical factor in determining the success of applications, JavaMelody emerges as a powerful ally for developers. By seamlessly integrating with Spring Boot 3, JavaMelody empowers developers to monitor, analyze, and optimize their applications’ performance, ensuring a smooth and responsive user experience.
With its comprehensive suite of features, including real-time monitoring, profiling, and sampling, SQL query analysis, and remote monitoring and alerting capabilities, JavaMelody equips developers with the tools they need to identify and address performance bottlenecks proactively.
By embracing JavaMelody and combining it with established performance engineering best practices, developers can unlock new levels of performance optimization, enabling their Spring Boot applications to deliver exceptional user experiences while efficiently utilizing system resources.
As the demand for high-performance, scalable, and responsive applications continues to grow, the integration of JavaMelody into the Spring Boot ecosystem represents a significant step forward in empowering developers to meet and exceed these expectations, cementing their position as leaders in software engineering and performance optimization.


