
Prometheus monitors the performance and health of servers, databases, and other infrastructure components. Applications are instrumented with Prometheus client libraries to expose metrics at an HTTP endpoint.
In Spring Boot 3, an actuator and micrometer expose metrics to Prometheus, which gathers the data.

Grafana provides powerful templating features that allow users to create dynamic dashboards. Variables can be used to create drop-downs and repeat panels or rows. Grafana creates the dashboards from Prometheus’s data and sends them to Visualizer. Monitoring applications can be sent via email.


Create a Spring Boot 3 with the actuator.
The developer creates a Spring Boot actuator and exposes metrics to the Prometheus server.
Create Prometheus and Grafana servers on Docker.
The developer creates a Docker Compose to pull the images and start the server.
Directory Structure
/prometheus-grafana
├── docker-compose.yml
├── prometheus.yml
In the “docker-compose.yml” file. The file contains the configuration of the Prometheus and Grafana servers.
services:
  prometheus:
    image: prom/prometheus:latest
    container_name: prometheus
    volumes:
      - ./prometheus.yml:/etc/prometheus/prometheus.yml
    ports:
      - "9090:9090"
    networks:
      - monitoring
  grafana:
    image: grafana/grafana:latest
    container_name: grafana
    ports:
      - "3000:3000"
    environment:
      - GF_SECURITY_ADMIN_PASSWORD=admin
      - GF_SECURITY_ADMIN_USER=admin
    volumes:
      - grafana-storage:/var/lib/grafana
    networks:
      - monitoring

volumes:
  grafana-storage:
networks:
  monitoring:
    driver: bridge
In the “prometheus.yml” file. The file contains the configuration to pull the data from the client.
global:
  scrape_interval: 30s

scrape_configs:
  - job_name: 'prometheus'
    static_configs:
      - targets: ['localhost:8080']
metrics_path: /actuator/prometheusscrape_interval: Gathering the data from the client every 30 seconds.
The developer must adjust this attribute not too frequently because that may impact the application’s performance.
Spring Boot Actuator with authentication.
In the “prometheus.yml” file. When a Spring Boot application uses basic authentication from Spring Security.
scrape_configs:
- job_name: 'spring-boot-app'
static_configs:
- targets: ['localhost:8080']
metrics_path: /actuator/prometheus
basic_auth:
username: 'admin'
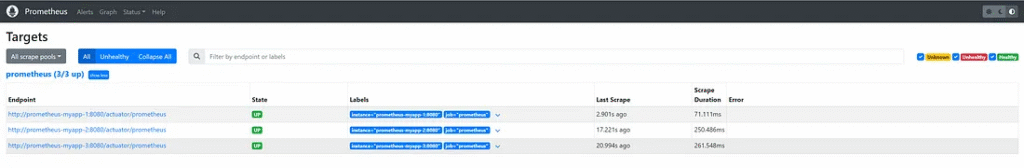
password: 'admin'Spring Boot with multiple instances.
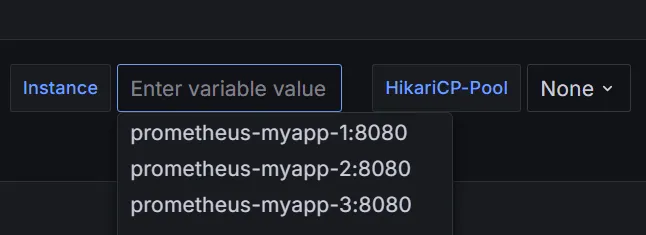
In the target, an attribute is an array. The developer can add instances to targets that are separated by a comma.
scrape_configs:
  - job_name: 'prometheus'
    static_configs:
      - targets: ['prometheus-myapp-1:8080','prometheus-myapp-2:8080','prometheus-myapp-3:8080']
    metrics_path: /actuator/prometheus
    basic_auth:
      username: 'admin'
      password: 'admin'
Execute the Docker command to pull an image and start the server.
docker-compose up -d
The -d flag in the docker-compose up -d Command stands for “detached mode.” When you run Docker Compose with the -d flag, the containers start in the background, allowing you to continue using the terminal.
The network name is “prometheus-grafana_monitoring”.
Docker generates a network name by combining the directory name and network name inside the Docker Compose file.
The developer can check the network name using the Docker command.
docker network ls
NETWORK ID     NAME                            DRIVER    SCOPE
780eef27ec97   prometheus-grafana_monitoring   bridge    local
Check the status of the server.
The developer can check the server status using the Docker command.
docker container ls
CONTAINER ID   IMAGE                    COMMAND                  CREATED          STATUS          PORTS                           NAMES
4a1129798e36   grafana/grafana:latest   "/run.sh"                48 minutes ago   Up 48 minutes   0.0.0.0:3000->3000/tcp          grafana
cbe94f2742a1   prom/prometheus:latest   "/bin/prometheus --c…"   48 minutes ago   Up 48 minutes   0.0.0.0:9090->9090/tcp          prometheus
Access the Prometheus server.
The developer can monitor an application from Prometheus via
“http://localhost:9090/”.
The developer can view the status of an application from Prometheus.
The developer can check the health of each application.
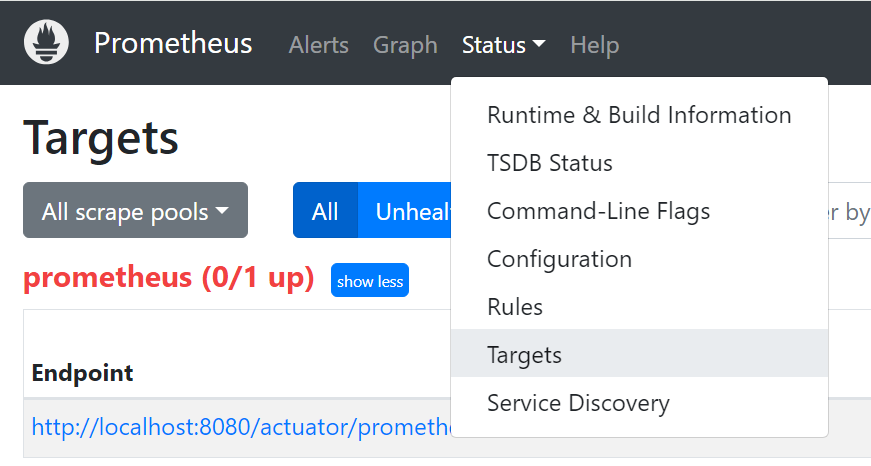
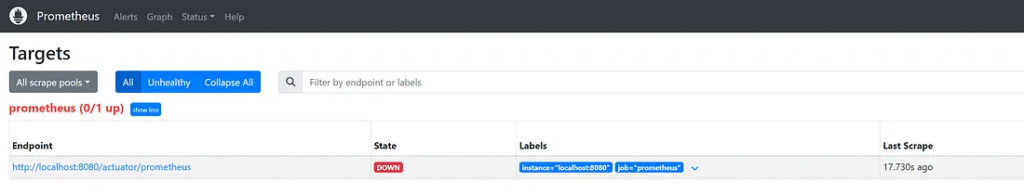
The status of an application will update every 30 seconds, which is configured in the “prometheus.yml” file.
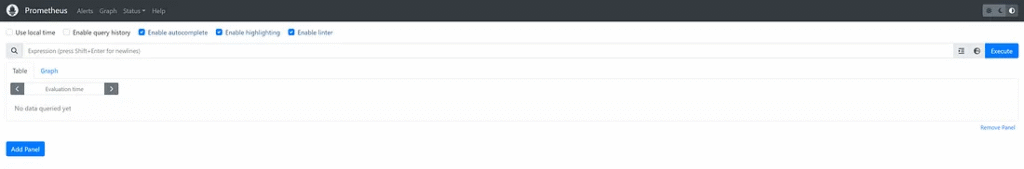
Monitor the environment on Prometheus.
Search the metrics for the monitor.
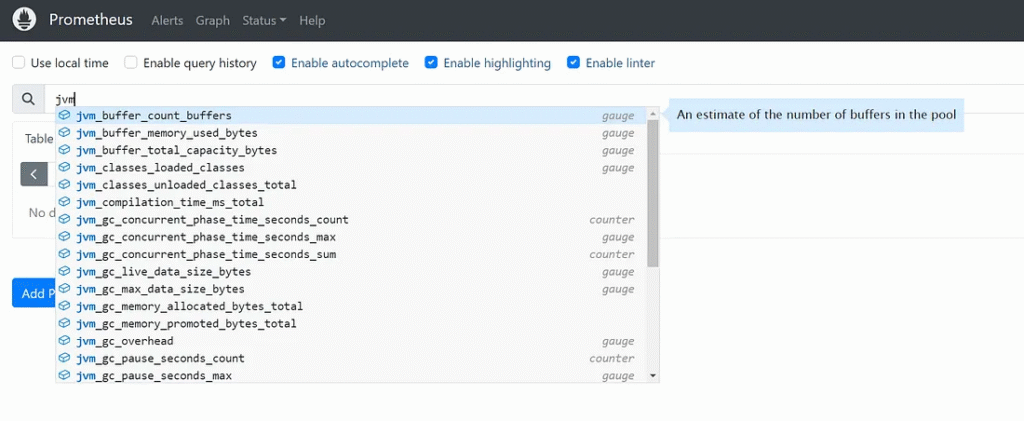
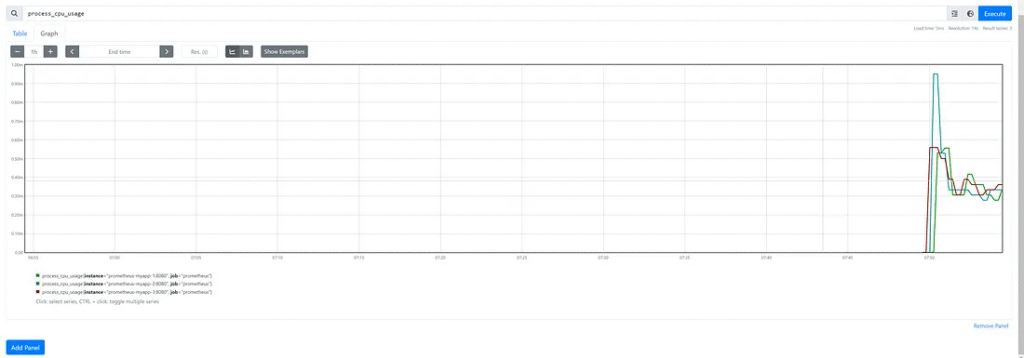
View metrics data in the graph and filter instances.
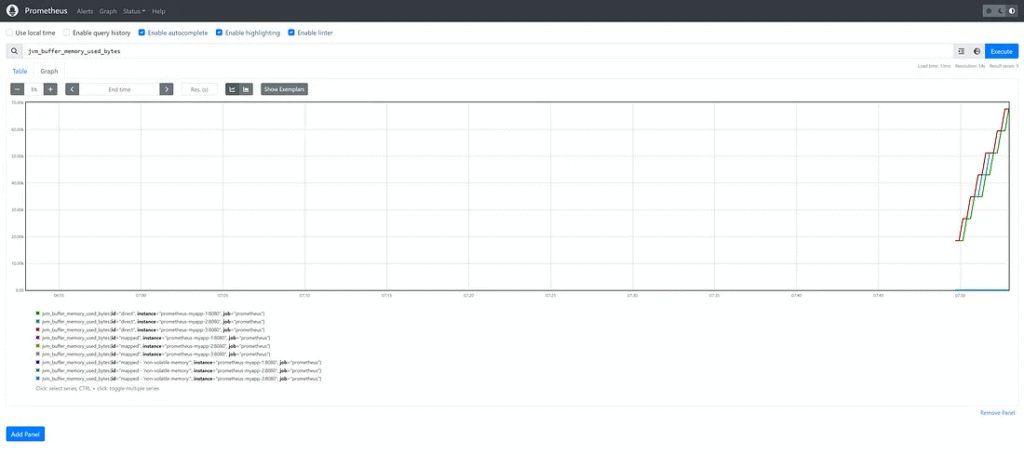
Add metrics data for the monitor using the Add Panel button.
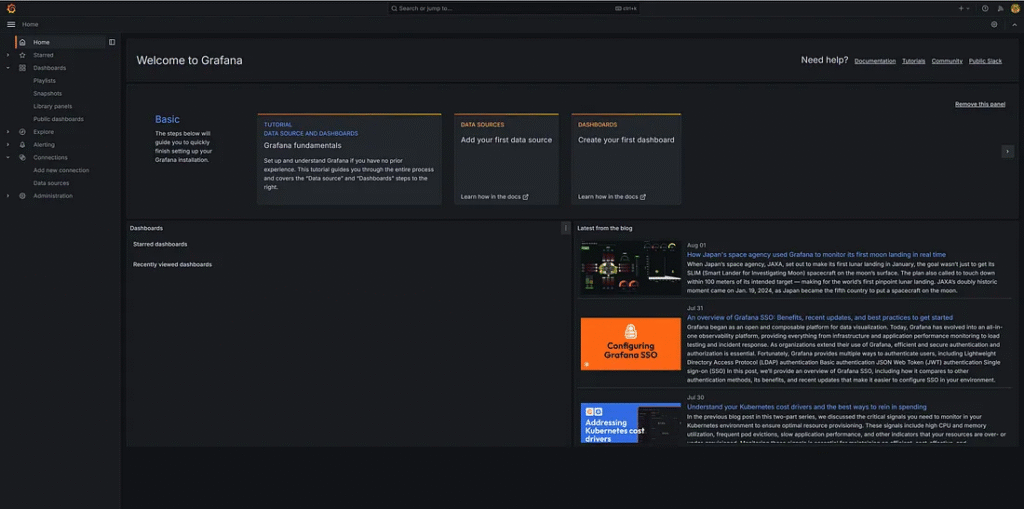
Access the Grafana server.
Access the Grafana server via “http://localhost:3000/”.
Connect the data sources from Prometheus. Select data sources from the menu and click “add data sources.”
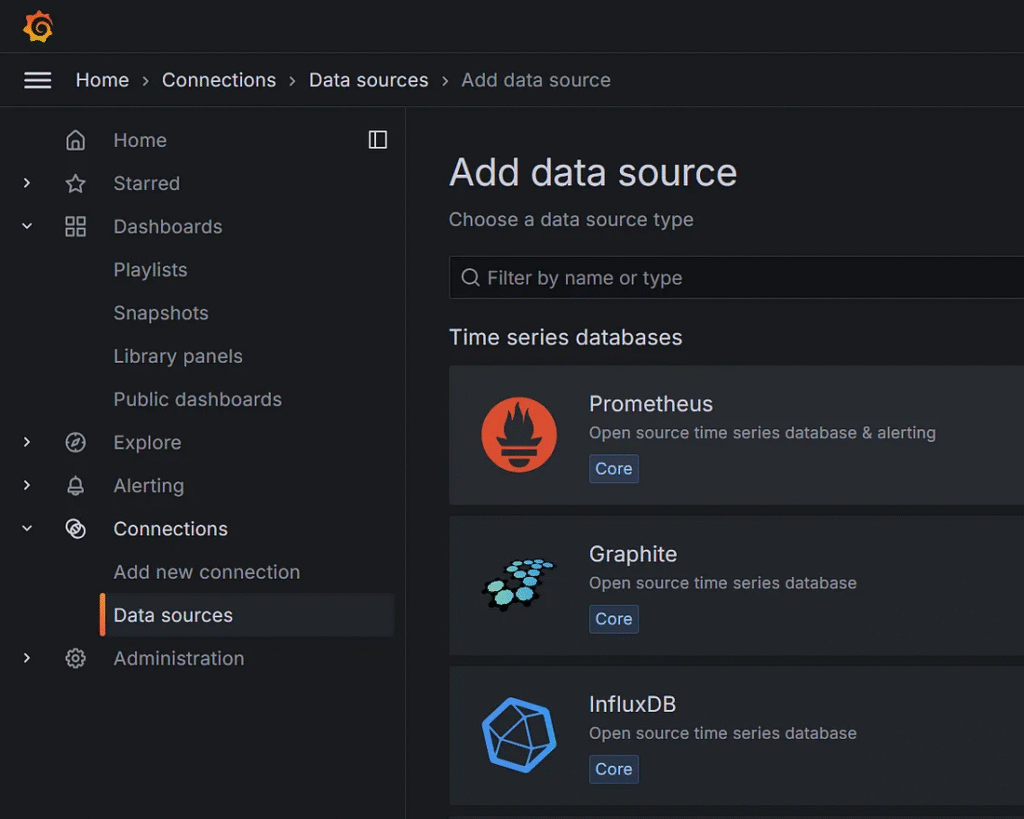
Choose ”Prometheus”.
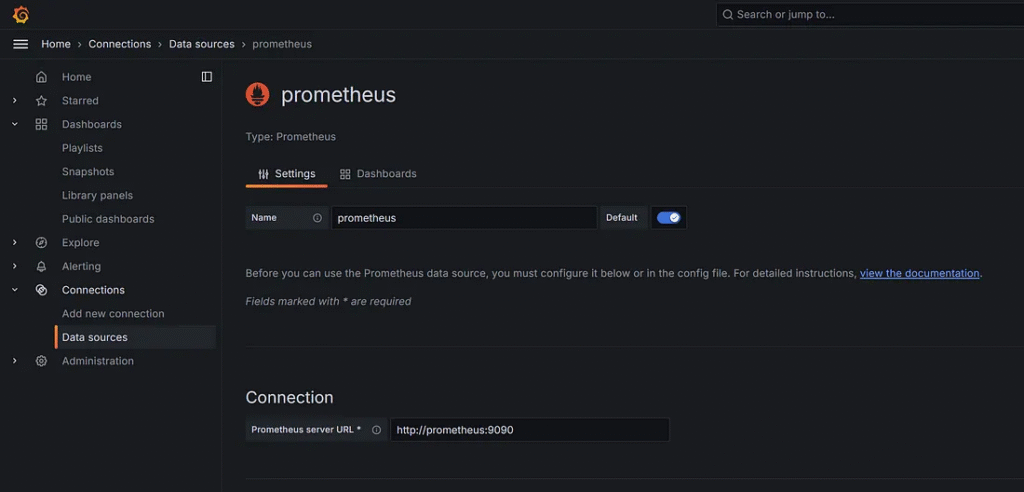
In Prometheus server URL field. Input “http://prometheus:9090”.
In the Scrape interval field. Input “30s”.
In the Query timeout field. Input “60s”.
The developer can check the alias name or IP address for the Prometheus server URL from the Docker command.
docker inspect prometheus
"Networks": {
"prometheus-grafana_monitoring": {
"IPAMConfig": null,
"Links": null,
"Aliases": [
"prometheus",
"prometheus"
],
"MacAddress": "02:42:ac:12:00:03",
"DriverOpts": null,
"NetworkID": "6f1ca0fcb54322dc4547d642584995d99c55f0431c67fcae28d50db5e85dc0ea",
"EndpointID": "257781a33371b7740a80066301f8307b95edef4aacc5075804b640c88cf98d99",
"Gateway": "172.18.0.1",
"IPAddress": "172.18.0.3",
"IPPrefixLen": 16,
"IPv6Gateway": "",
"GlobalIPv6Address": "",
"GlobalIPv6PrefixLen": 0,
"DNSNames": [
"prometheus",
"cbe94f2742a1"
]
}
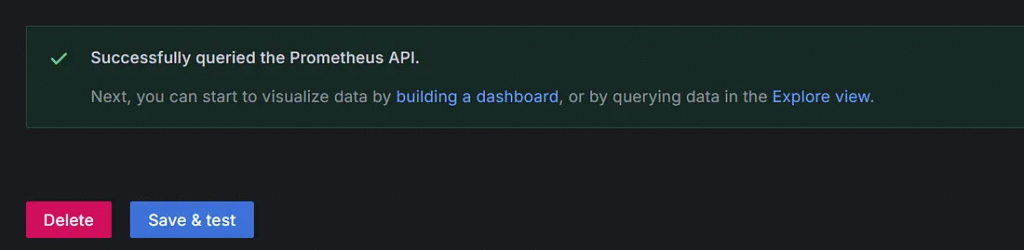
}Click the “Save & Test” button.
Create Dashboard.
Grafana provides various dashboards. The beginner recommends importing an instant dashboard from Grafana.
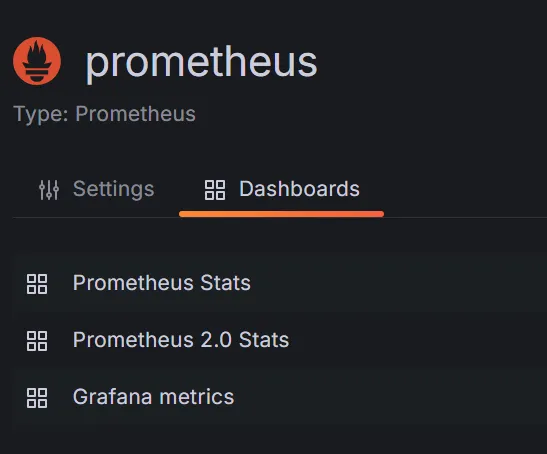
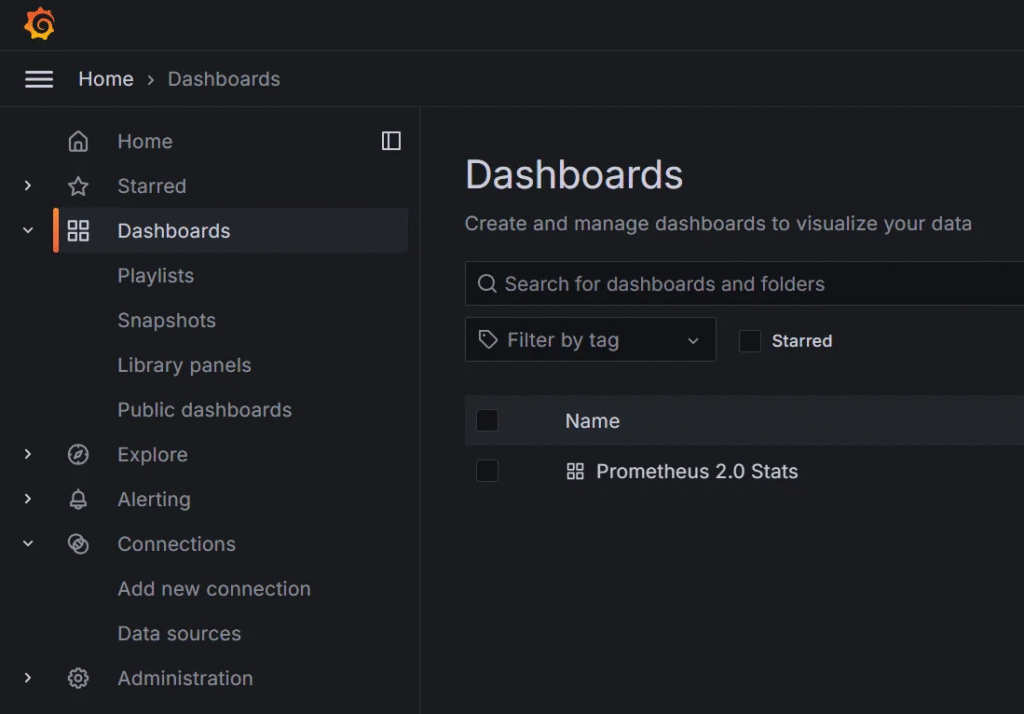
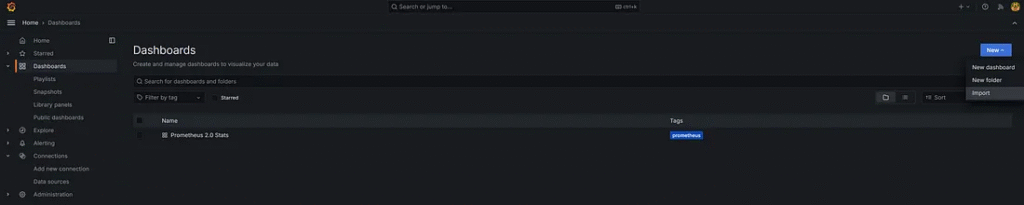
Go to the Dashboard menu.
Create a Dashboard for monitoring the Spring Boot 3 application.
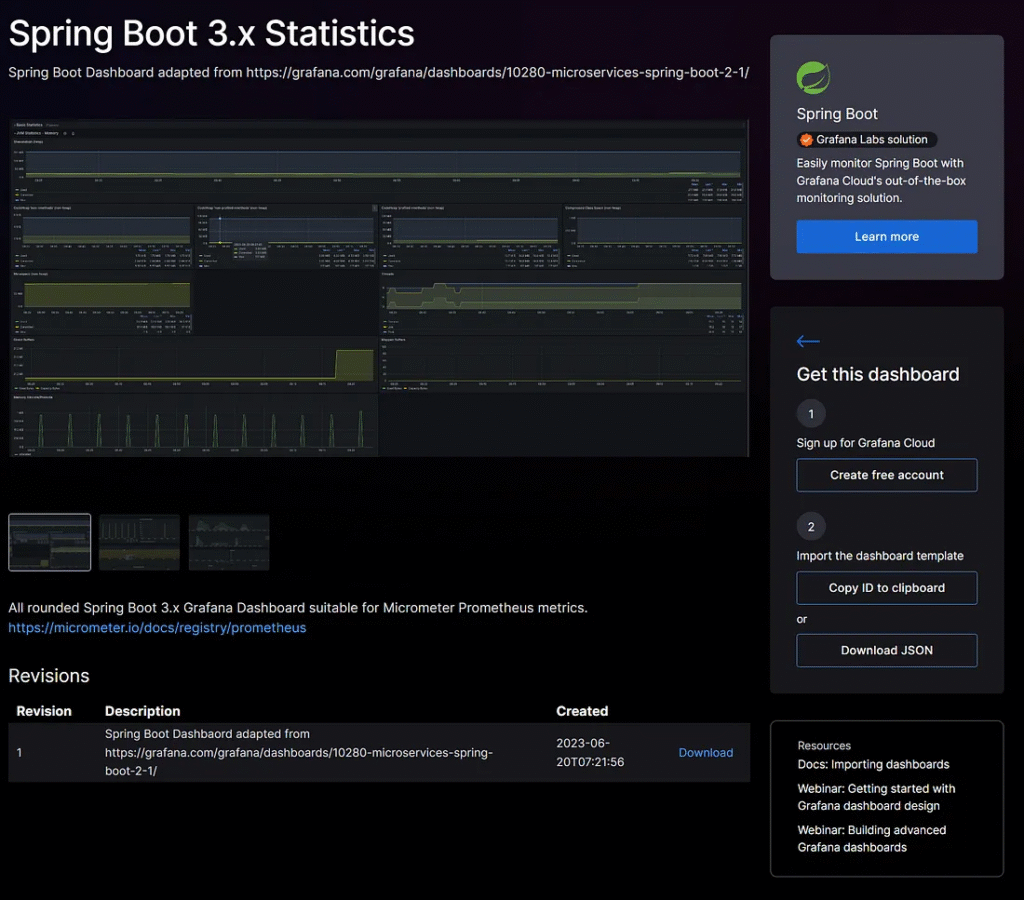
Explore the dashboard from Grafana.

Copy the ID or download a JSON file to import the dashboard.
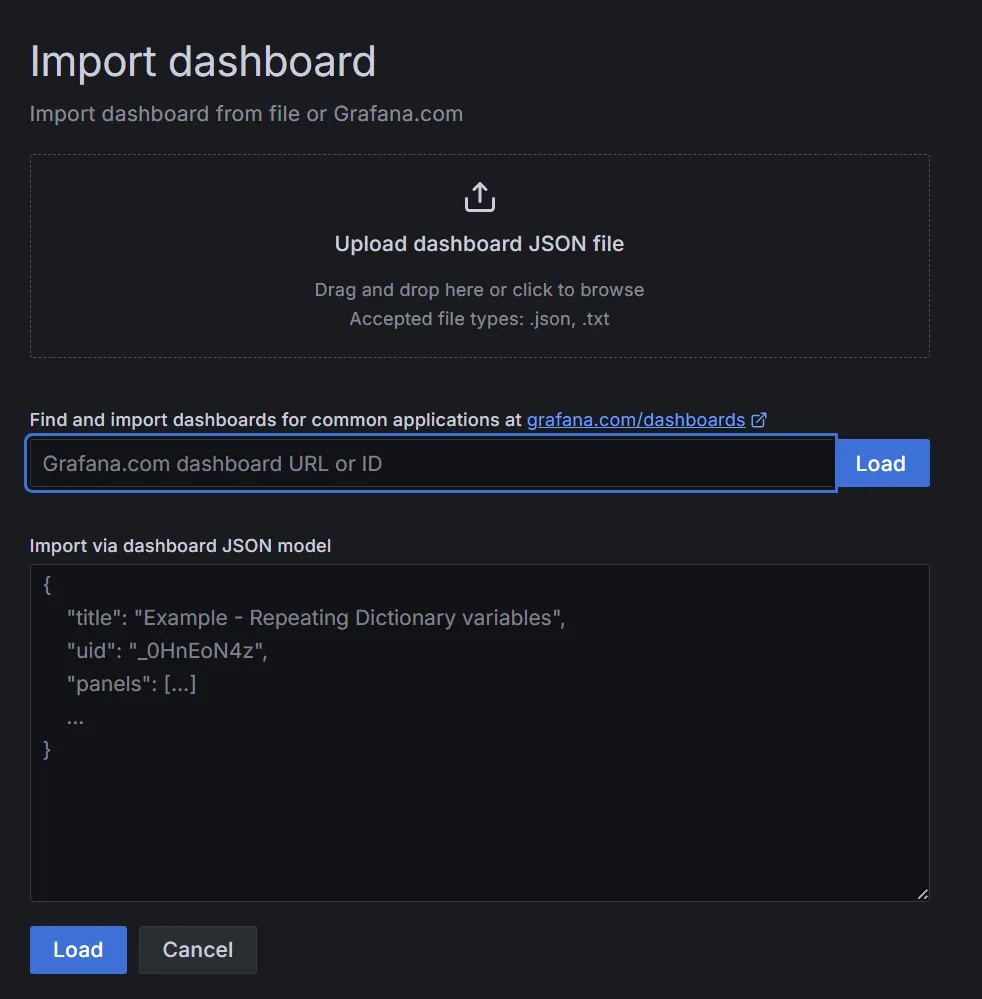
Click the “New” button in the dashboard menu and choose “Import”.
The developer can upload a JSON file or use an import dashboard by dashboard ID.
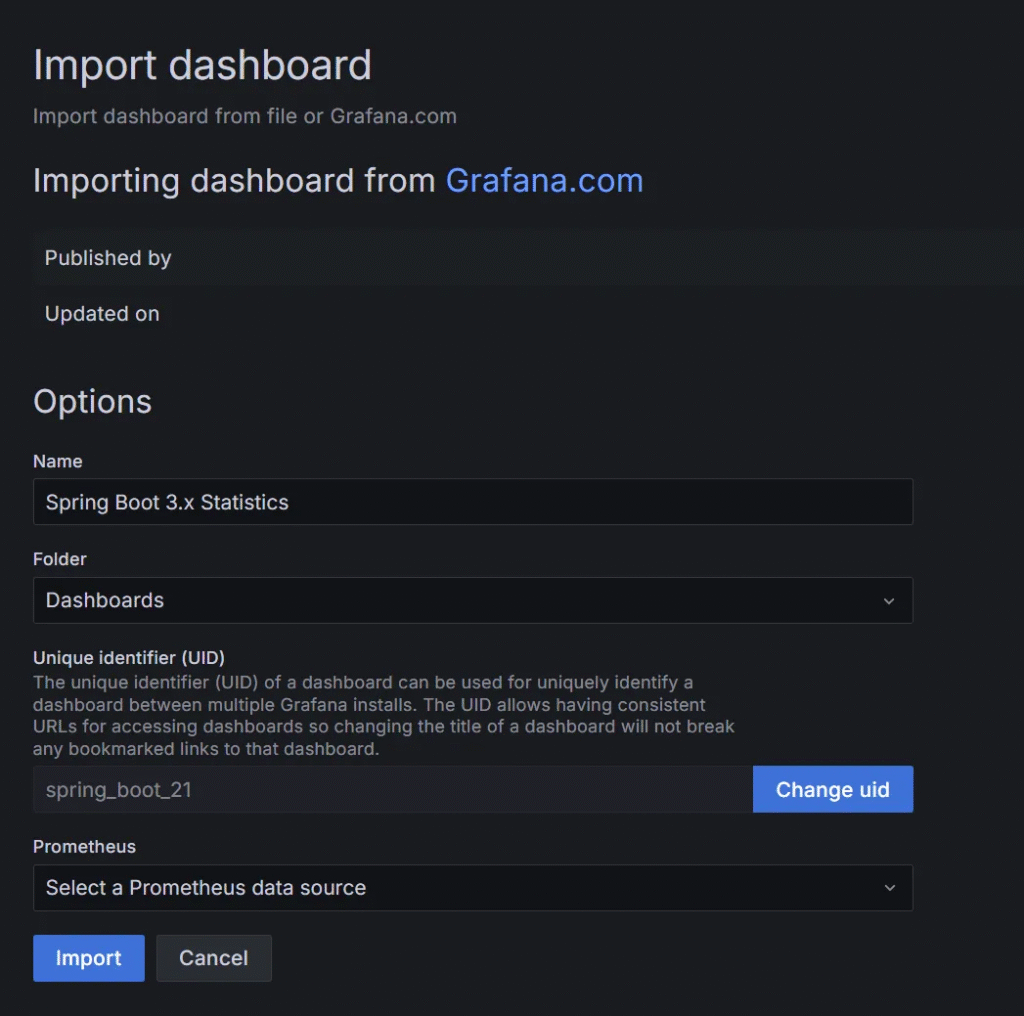
The developer configures the dashboard name and UID.
The developer chooses the data source for Prometheus.
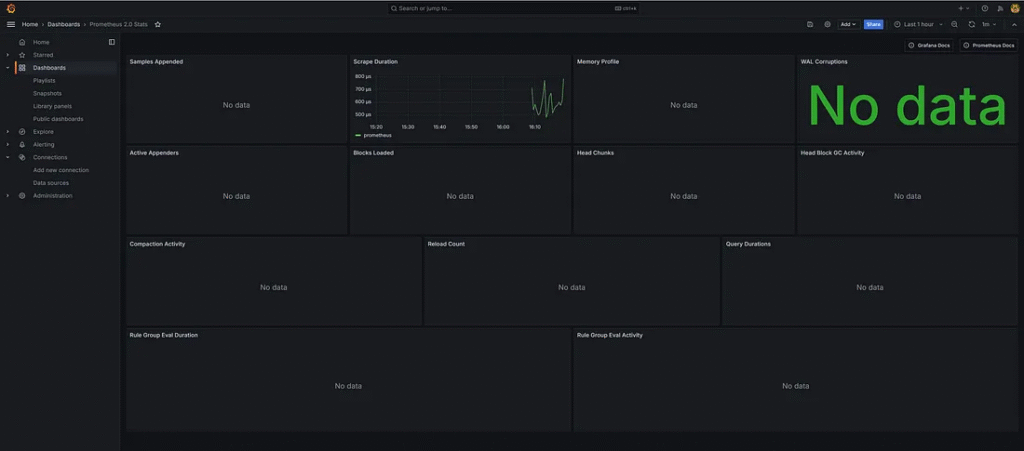
The dashboard visualizes the data.
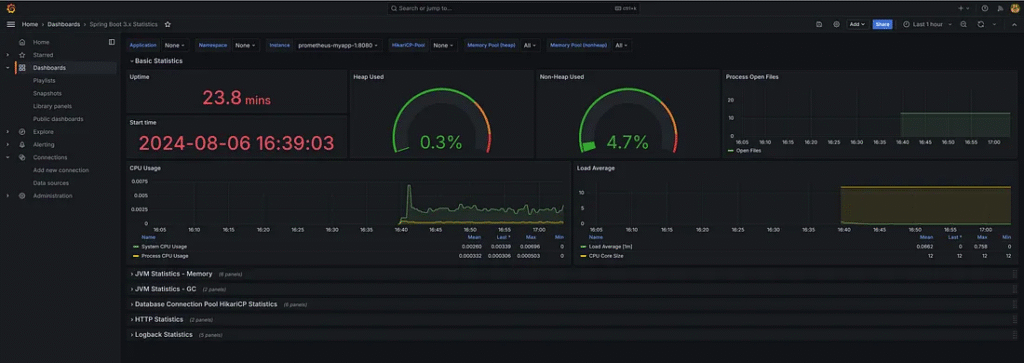
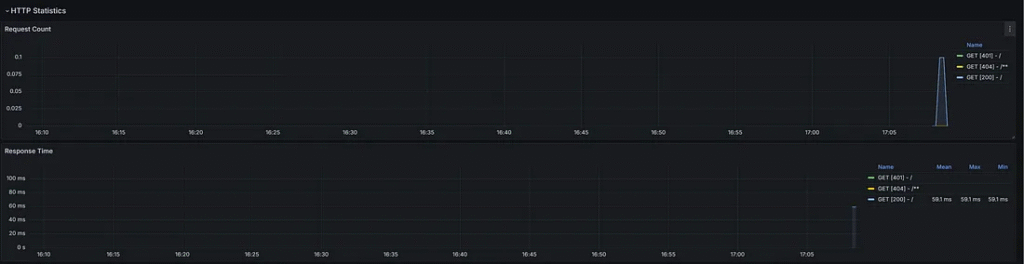
The developer views each instance in Prometheus.
If the dashboard in the HTTP statistics tab does not show, the developer should check the “Scrape interval” in the “promethus.yml” file, and The value scrape interval in the Prometheus data source in Grafana uses the same interval value.
Finally
Prometheus is a powerful tool for gathering and viewing client data in a graph. Grafana transforms the data source in Prometheus into a visualized dashboard that is easy to monitor.
The developer combines tools that increase efficiency for monitoring a Spring Boot 3 application, making it easy to maintain and quickly find the cause of a problem. This increases the development team’s performance and gains the customer’s trust.


