Your API Is Fast… Until It Isn’t
The dashboard looked perfect. Average latency was around 3 ms. Throughput was above 14,000 requests per second. Error rate stayed at 0%.
If you stopped there, you would probably call the API healthy.
But a few users were still seeing slow responses. Not constant slowness. Not an outage. Just random requests that suddenly took 500 ms or more. That is the kind of performance issue that hides in production because the system looks fine from a distance.
The root cause was not the database being permanently slow. It was not Redis being slow either. The spike happened at a very specific moment: when a hot Redis key expired and many concurrent requests tried to rebuild it at the same time.
The Incident
This experiment simulates a pattern I have seen in real backend systems: an endpoint is fast for most requests, then suddenly slow for a small group of requests every time the cache expires.
The dangerous part is that the slow requests are rare compared to the total volume. They barely move the average, but they absolutely affect real users.
| Signal | What it showed |
| Average latency | 3 ms |
| Maximum latency | 556 ms |
| Throughput | 14,462 requests/sec |
| Error rate | 0% |
| User experience | Occasional latency spikes during cache expiration |
Initial Assumption
When people hear “Redis cache,” they often assume the cache removes the performance problem. That assumption is incomplete. Redis makes cache hits fast, but expiration creates a transition moment where the application falls back to the slower path.
The first theory was simple: maybe the API was fine because the average latency was low. The second theory was that the database latency was causing the occasional spikes. Both were too shallow. The important question was: what happens exactly when the cached value disappears?
Experiment Overview
The setup was intentionally small so the behavior would be easy to isolate.
- Spring Boot API endpoint.
- Redis cache with a 30-second TTL.
- Simulated database latency between 100 and 300 ms.
- JMeter load test sending many requests to the same key.
- One hot cache key to make expiration behavior visible.
GET /api/cache/test/1
All requests targeted the same key on purpose. In production, this is common for hot data: product details, account configuration, feature flags, exchange rates, permission snapshots, reporting metadata, or any shared object that many users request repeatedly.
The Cache Path
The normal path is fast because Redis returns the value immediately. The slow path appears only when Redis misses and the application has to rebuild the value.
public Response getData(Long id) {
    String cacheKey = "cache:test:" + id;

    Response cached = redisTemplate.opsForValue().get(cacheKey);
    if (cached != null) {
        return cached;
    }

    Response value = database.loadData(id); // simulated 100-300 ms
    redisTemplate.opsForValue().set(cacheKey, value, Duration.ofSeconds(30));

    return value;
}
There is nothing unusual in this code. This is the standard cache-aside pattern. The problem is not the pattern itself. The problem is what happens when many threads execute the miss path at the same time.
Real Performance Results
The JMeter result looked excellent at first glance.
| Metric | Result |
| Total requests | 1,734,951 |
| Average latency | 3 ms |
| Maximum latency | 556 ms |
| Throughput | 14,462 requests/sec |
| Error rate | 0% |
This is exactly why average latency can be dangerous. A few hundred slow requests can disappear inside more than a million fast cache hits. The average stays low, while the users who hit the expiration window still experience a slow API.
The Hidden Problem
The slow responses appeared when three things happened at the same time:
- The Redis entry expired.
- Many concurrent requests missed the cache.
- Those requests fell back to the database or expensive rebuild logic together.
That moment creates a short burst of latency. The cache is fast before expiration. It is fast again after one request repopulates the value. But during the miss window, the endpoint behaves like the cache does not exist.
cache hit  -> 3 ms
cache hit  -> 4 ms
cache hit  -> 3 ms
cache miss -> 281 ms
cache miss -> 344 ms
cache miss -> 512 ms
cache hit  -> 3 ms
cache hit  -> 4 ms
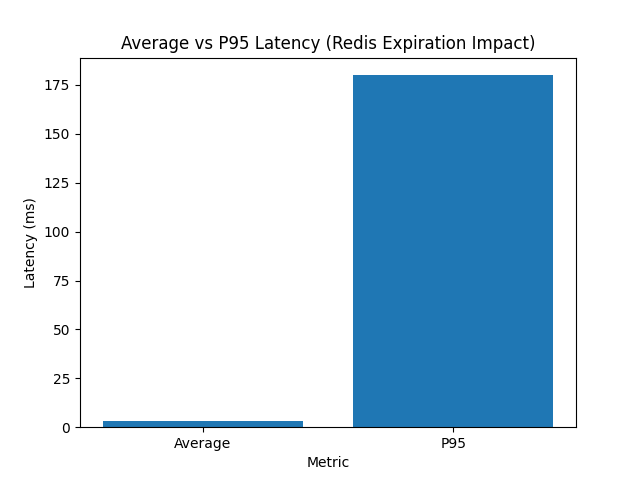
Why Average Latency Fails
Average latency compresses the whole system into one number. That is useful for a quick summary, but it is a weak signal for bursty performance problems.
| Request group | Latency |
| ~99% of requests | 3-5 ms |
| ~1% of requests | 200-500+ ms |
| Average result | ~3 ms |
The average says the service is fast. The maximum says at least one user had a very different experience. P95 and P99 are the metrics that expose this gap.
Visualizing the Behavior
When latency is plotted over time, the pattern is easier to understand. It is not random noise. It forms a repeating wave: stable low latency, sudden spike, recovery, then another spike at the next expiration cycle.
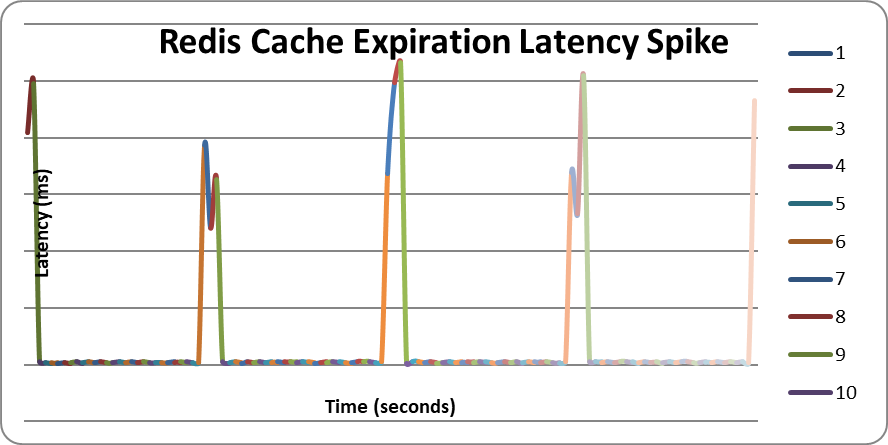
That wave is the important clue. If the spike repeats around the TTL boundary, the cache expiration policy is part of the performance profile.
Root Cause: Cache Stampede
At the moment of expiration, the cache entry is removed. The next request misses Redis and rebuilds the value. If traffic is low, this may be fine. If traffic is high, many requests can miss at nearly the same time.
That is cache stampede. The system does not have one request rebuilding the value. It has many requests doing the same expensive work concurrently.
- Redis removes the key at the TTL boundary.
- Concurrent requests miss the same key.
- Each request calls the database or expensive loader.
- Database and CPU load rise briefly.
- Latency spikes until the cache is repopulated.
This is why cache expiration is not passive. It is an active performance event.
Why It Matters in Production
In production, hot keys are rarely evenly distributed. Some keys receive much more traffic than others. When those keys expire, the miss window can create a sudden load burst against downstream systems.
This can show up as API latency, database CPU spikes, connection pool pressure, thread pool saturation, or short cascading failures. The API may still have a 0% error rate, but users feel the delay.
What You Should Measure Instead
For cache-related performance work, average latency is not enough. You need metrics that preserve the shape of the slowdown.
- P95 and P99 latency for the API endpoint.
- Maximum latency during load tests.
- Redis cache hit ratio by key or endpoint.
- Database query rate during cache expiration windows.
- Cache evictions, misses, and rebuild duration.
- Thread pool and connection pool saturation.
The goal is to correlate the API spike with cache misses and database activity. If the spike aligns with the TTL boundary, the cache policy is no longer just an optimization detail. It is part of the system behavior.
How to Prevent Cache Stampede
1. Add TTL Jitter
If every hot key uses the same TTL, many keys can expire together. TTL jitter spreads expiration times so the system avoids synchronized misses.
int baseTtlSeconds = 30;
int jitterSeconds = ThreadLocalRandom.current().nextInt(10);

Duration ttl = Duration.ofSeconds(baseTtlSeconds + jitterSeconds);
redisTemplate.opsForValue().set(cacheKey, value, ttl);
Jitter is simple and cheap. It does not eliminate cache misses, but it reduces the chance that many expensive rebuilds happen at exactly the same time.
2. Use a Distributed Lock
For very hot keys, you may want only one request to rebuild the cache while the others wait, retry, or serve stale data.
String lockKey = "lock:" + cacheKey;
boolean locked = redisTemplate.opsForValue()
    .setIfAbsent(lockKey, "1", Duration.ofSeconds(5));

if (locked) {
    try {
        Response value = database.loadData(id);
        redisTemplate.opsForValue().set(cacheKey, value, ttl);
        return value;
    } finally {
        redisTemplate.delete(lockKey);
    }
}

return waitAndReadFromCache(cacheKey);
The trade-off is complexity. A lock can protect the database, but you must handle lock timeout, failure paths, and what callers do while the refresh is in progress.
3. Cache Preloading
For known hot keys, refresh the cache before users hit the expiration window. This is useful for predictable data such as configuration, dashboards, top products, tenant metadata, and reporting summaries.
@Scheduled(fixedDelay = 20_000)
public void refreshHotKeys() {
    for (Long id : hotKeyRegistry.ids()) {
        Response value = database.loadData(id);
        redisTemplate.opsForValue().set(cacheKey(id), value, Duration.ofSeconds(40));
    }
}
Preloading moves work out of the request path. The trade-off is that the system now spends background capacity to keep data warm.
4. Stale-While-Revalidate
Another option is to serve the old value for a short period while refreshing the cache in the background. This protects user latency when slightly stale data is acceptable.
CachedValue cached = cache.get(cacheKey);

if (cached != null && !cached.isHardExpired()) {
    if (cached.isSoftExpired()) {
        refreshExecutor.submit(() -> refresh(cacheKey, id));
    }
    return cached.value();
}

return refreshSynchronously(cacheKey, id);
This is often a strong trade-off for read-heavy systems. Users get stable latency, and the application refreshes data without forcing every request to wait.
Engineering Lessons
- A low average latency does not prove the API is healthy.
- Redis TTL expiration can create predictable latency spikes.
- Hot keys need different treatment from ordinary cache entries.
- P95, P99, max latency, and hit ratio matter more than average alone.
- Cache stampede prevention is part of production cache design, not an optional polish step.
Final Thoughts
Redis caching is powerful, but a cache is not just a fast lookup. It has lifecycle behavior. Expiration, rebuilds, and hot keys all shape production latency.
The API in this experiment looked excellent by average latency. The real story appeared only when looking at the slowest requests and correlating them with cache expiration.
The most dangerous performance issues are often the ones your dashboard smooths away.