
Zipkin is a distributed tracing system that helps you collect, visualize, and troubleshoot latency issues in microservice architectures. It is beneficial in scenarios where a request may pass through multiple services, and you want to understand the performance characteristics, bottlenecks, or failures that occur along the way.
Introduction
Software development design RESTful API using a micrometre collects and sends trace data (spans) to the Zipkin server to monitor RESTful API performance. This makes it easy to track which processes are slow and easy to maintain. The developer can choose which method in the workflow should be traced and view the process time in each traced process.
How Zipkin helps the development team improve the performance of the trace process to find a problem.
When the client informs the development team that the RESTful API is slow or has a problem, the team can directly trace the slow process in the workflow on the Zipkin server. Otherwise, the development team can view the log file and get a trace ID to identify the slow process in the workflow. The trace ID can also be used on the Zipkin server.
Create a Zipkin server on Docker.
1. Directory structure.
/zipkin-project
├── docker-compose.yml
2. Create a “docker-compose.yml” file.
version: '3.7'
services:
  zipkin:
    image: openzipkin/zipkin
    ports:
      - "9411:9411"
    networks:
      - monitoring
networks:
  monitoring:
    driver: bridge
3. Pull the image and start the Zipkin server with the Docker command.
docker-compose up -d
The -d flag in the docker-compose up -d Command stands for “detached mode.” When you run Docker Compose with the -d flag, the containers start in the background, allowing you to continue using the terminal.
4. Check the image of the Zipkin server on Docker.
>docker images
REPOSITORY                                      TAG       IMAGE ID       CREATED        SIZE
openzipkin/zipkin                               latest    88de2581a6c0   9 days ago     183MB
5. Check the container of the Zipkin server on Docker.
>docker container ls
CONTAINER ID   IMAGE               COMMAND                  CREATED             STATUS                       PORTS                              NAMES
ea30e88839aa   openzipkin/zipkin   "start-zipkin"           About an hour ago   Up About an hour (healthy)   9410/tcp, 0.0.0.0:9411->9411/tcp   zipkin-zipkin-1
Conclusion
The Zipkin server is ready to receive trace data (spans) from the RESTful API.
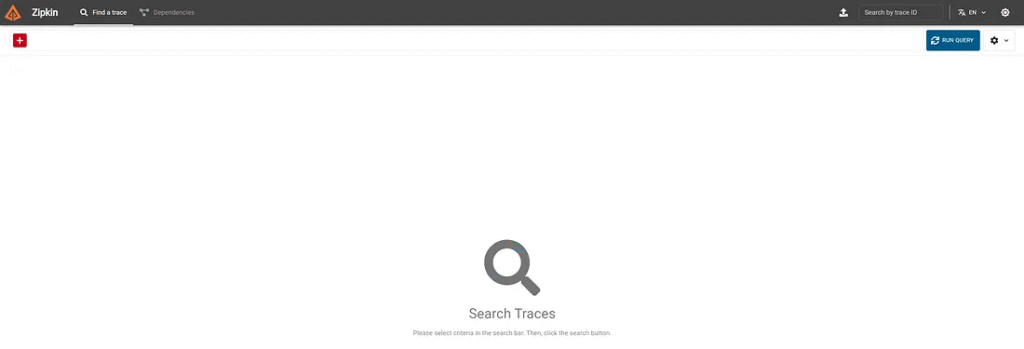
Access the Zipkin server.
The developer can access the Zipkin server through the browser with the URL http://localhost:9411/zipkin/.
The RESTful API connects to the Zipkin server.
The developer can connect the RESTful API Zipkin server through the application properties file.
1. Add the required Maven dependencies.
 <dependencies>
    <dependency>
     <groupId>org.springframework.boot</groupId>
     <artifactId>spring-boot-starter-actuator</artifactId>
    </dependency>
    <dependency>
     <groupId>org.springframework.boot</groupId>
     <artifactId>spring-boot-starter-web</artifactId>
    </dependency>
    <!-- Spring Boot Starter AOP (Optional, if not already included) -->
    <dependency>
        <groupId>org.springframework.boot</groupId>
        <artifactId>spring-boot-starter-aop</artifactId>
    </dependency>
    <dependency>
     <groupId>io.micrometer</groupId>
     <artifactId>micrometer-tracing-bridge-brave</artifactId>
    </dependency>
    <dependency>
     <groupId>io.zipkin.reporter2</groupId>
     <artifactId>zipkin-reporter-brave</artifactId>
    </dependency>
    <dependency>
     <groupId>org.springframework.boot</groupId>
     <artifactId>spring-boot-devtools</artifactId>
     <scope>runtime</scope>
     <optional>true</optional>
    </dependency>
    <dependency>
     <groupId>org.springframework.boot</groupId>
     <artifactId>spring-boot-starter-test</artifactId>
     <scope>test</scope>
    </dependency>
    <!-- https://mvnrepository.com/artifact/org.projectlombok/lombok -->
    <dependency>
        <groupId>org.projectlombok</groupId>
        <artifactId>lombok</artifactId>
        <version>1.18.34</version>
        <scope>provided</scope>
    </dependency>
 </dependencies>
2. Using application.propertie
spring.zipkin.base-url=http://localhost:9411
spring.sleuth.sampler.probability=1.0
spring.reactor.context-propagation= AUTO

# ===============================
# = MICROMETER
# ===============================
management.tracing.sampling.probability=1.0
Alternatively, Using application.yml
spring:
  zipkin:
    base-url: http://localhost:9411
  sleuth:
    sampler:
      probability: 1.0
  reactor:
    context-propagation: AUTO
management:
  tracing:
    sampling:
      probability: 1.0
3. Create a user profile bean.
import lombok.Getter;
import lombok.Setter;
import lombok.ToString;

@Getter
@Setter
@ToString
public class UserProfileBean {

    private String username;
    private String email;
    private String traceId;

    public UserProfileBean(String username, String email, String traceId) {
        this.username = username;
        this.email = email;
        this.traceId = traceId;
    }

}
4. Create a REST controller.
import io.micrometer.tracing.Tracer;
import org.springframework.beans.factory.annotation.Autowired;
import org.springframework.http.ResponseEntity;
import org.springframework.web.bind.annotation.GetMapping;
import org.springframework.web.bind.annotation.RestController;

@RestController
public class UserProfileController {

    private final Tracer tracer;

    @Autowired
    public UserProfileController(Tracer tracer) {
        this.tracer = tracer;
    }

    @GetMapping(path = "/user-profile")
    public ResponseEntity<UserProfileBean> getUserProfile(){
        String traceId = tracer.currentSpan().context().traceId();
        UserProfileBean bean = new UserProfileBean("John","demo@example.com",traceId);
        return ResponseEntity.ok().body(bean);
    }

}
5. Request RESTful API using the GET method.
>curl http://localhost:8080/user-profile
{"username":"John","email":"demo@example.com","traceId":"66bb1527e06b187ac42f6ba7397a4f9e"}
6. RESTful API returns a response user profile with a trace ID.
Monitor requests in the Zipkin server.
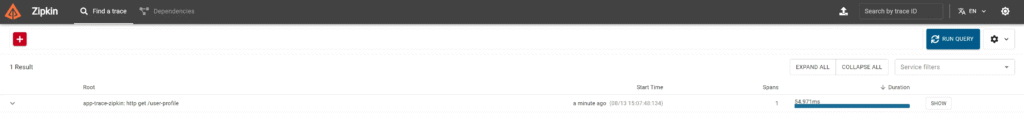
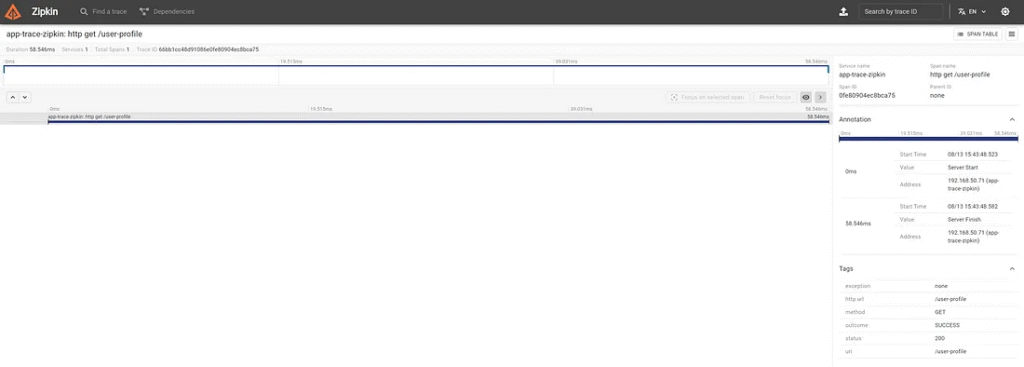
The request appears in a table containing the root, start time, span, and duration information. The developer can view the details by clicking the “SHOW” button.
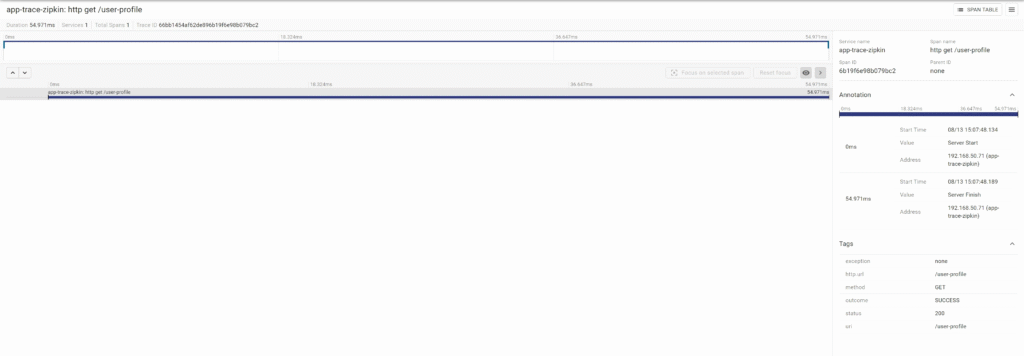
In the root detail, show the trace ID that matches the trace ID in the response.
An error message will appear in the panel when the application causes an exception in the Zipkin server.
Conclusion
RESTful API collects and sends trace data (spans) to the Zipkin server. The developer can use any detail to identify the performance of each process in the RESTful API, making the application easy to maintain.
Monitoring multiple processes in the workflow.
The developer can trace the process using the trace ID. Each process has a span ID. If the process is in the same workflow, the Zipkin server will show all span IDs in the workflow. The developer can trace all the processes in the workflow and identify which process may impact the workflow’s performance.
For example, when a client requests a user profile path, the controller calls the user profile service to return its data.
1. Create a user profile service implementation.
import io.micrometer.tracing.Tracer;
import org.springframework.beans.factory.annotation.Autowired;
import org.springframework.stereotype.Service;

@Service
public class UserProfileServiceImpl implements UserProfileServiceInf  {

    private final Tracer tracer;

    @Autowired
    public UserProfileServiceImpl(Tracer tracer) {
        this.tracer = tracer;
    }

    public UserProfileBean inquiryUserProfile(){
        String traceId = tracer.currentSpan().context().traceId();
        return new UserProfileBean("John","demo@example.com",traceId);
    }

}
2. Create a user profile service interface.
public interface UserProfileServiceInf {
    public UserProfileBean inquiryUserProfile();
}
3. Modify the user profile controller to call the service to get user profile data.
@RestController
public class UserProfileController {

    private  UserProfileServiceInf userProfileServiceInf;

    @Autowired
    public UserProfileController(UserProfileServiceInf userProfileServiceInf) {
        this.userProfileServiceInf = userProfileServiceInf;
    }

    @GetMapping(path = "/user-profile")
    public ResponseEntity<UserProfileBean> getUserProfile(){
        UserProfileBean bean = userProfileServiceInf.inquiryUserProfile();
        return ResponseEntity.ok().body(bean);
    }

}
4. Request RESTful API using the GET method.
>curl http://localhost:8080/user-profile
{"username":"John","email":"demo@example.com","traceId":"66bb1cf12637559e45207ee00b6f756f"}
5. Monitor requests in the Zipkin server.
6. The Zipkin server shows only a single trace ID and span ID.
Conclusion
The root should have two span IDs, but the other span ID in the workflow is not showing, and the developer can’t trace each process in the workflow. To solve the problem, the developer must use the Observed annotation.
Observed annotation.
The @Observed An annotation is part of Micrometer’s observation API, which was introduced to simplify and standardize metrics collection. This annotation allows developers to easily instrument methods and automatically capture metrics such as execution time, counts, exceptions, etc.
1. Add Maven dependency.
<dependency>
   <groupId>io.micrometer</groupId>
   <artifactId>micrometer-tracing-bridge-brave</artifactId>
</dependency>
<!-- Spring Boot Starter AOP (Optional, if not already included) -->
<dependency>
    <groupId>org.springframework.boot</groupId>
    <artifactId>spring-boot-starter-aop</artifactId>
</dependency>

2. Modify the user profile service by adding an observed annotation.
import io.micrometer.observation.annotation.Observed;
import io.micrometer.tracing.Tracer;
import org.springframework.beans.factory.annotation.Autowired;
import org.springframework.stereotype.Service;

@Service
public class UserProfileServiceImpl implements UserProfileServiceInf  {

    private final Tracer tracer;

    @Autowired
    public UserProfileServiceImpl(Tracer tracer) {
        this.tracer = tracer;
    }

    @Observed(name = "userProfile.inquiry", contextualName = "inquiryUserProfile")
    public UserProfileBean inquiryUserProfile(){
        String traceId = tracer.currentSpan().context().traceId();
        return new UserProfileBean("John","demo@example.com",traceId);
    }

}
3. Request RESTful API using the GET method.
>curl http://localhost:8080/user-profile
{"username":"John","email":"demo@example.com","traceId":"66bb241b65012e324e22b480dc6bc1ab"}
4. Monitor requests in the Zipkin server.
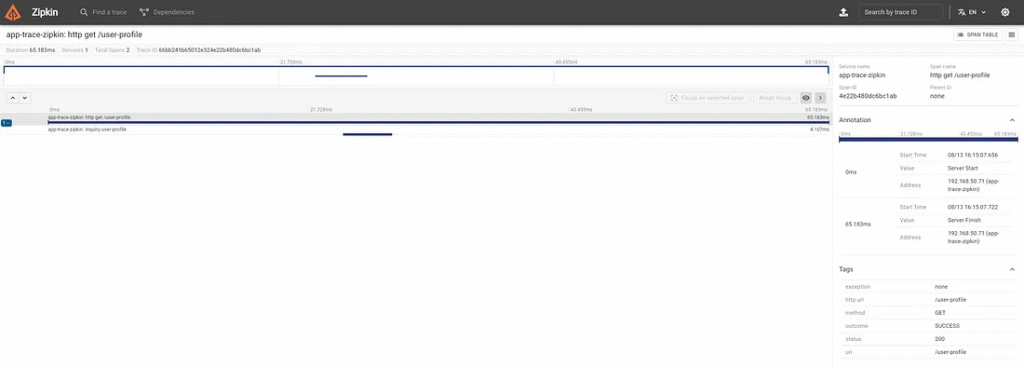
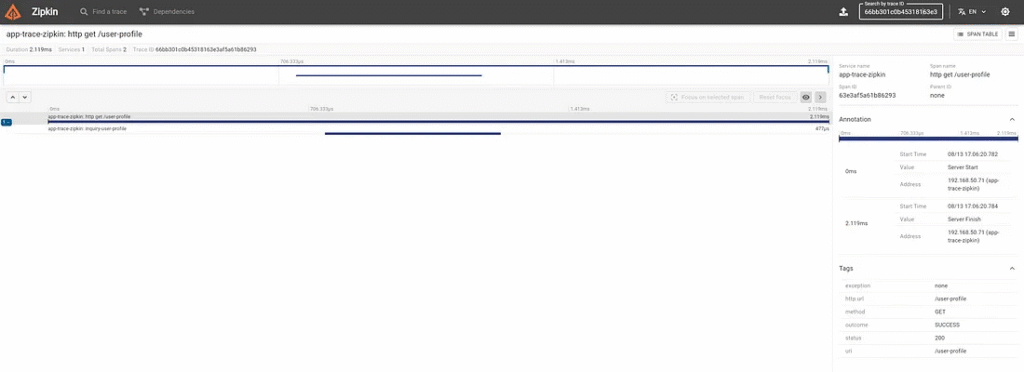
5. The root’s details show information for two spans. The developer can click on a span to view its details.
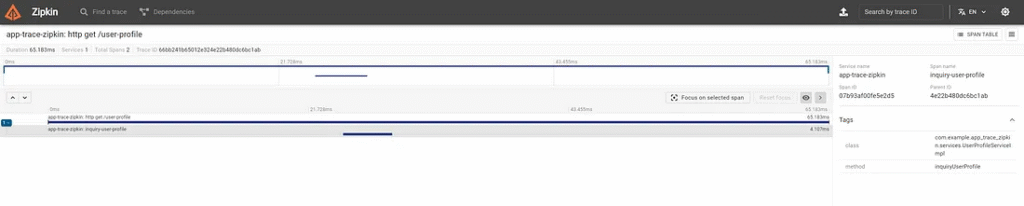
6. The second span shows the parent ID. The tag panel shows the class name and method name.
Conclusion
The developer can monitor each process’s time using observed annotations that help the developer trace specific processes.
Slf4j annotation to trace the Zipkin server.
The developer can use the log from the SLF4J annotation to trace the process in the Zipkin server. The trace ID is generated from the micrometre that collects and sends data to the Zipkin server.
1. Using application.propertie
# ===============================
# = LOGGER
# ===============================
logging.pattern.level=%5p [${spring.application.name:},%X{traceId:-},%X{spanId:-}]
Alternatively, Using application.yml
logging:
  pattern:
    level: "%5p [${spring.application.name:},%X{traceId:-},%X{spanId:-}]"
2. Modify the user service to log informational details.
@Observed(name = "userProfile.inquiry", contextualName = "inquiryUserProfile")
public UserProfileBean inquiryUserProfile(){
    String traceId = getTraceId();
    log.info("userProfile.inquiry");
    return new UserProfileBean("John","demo@example.com",traceId);
}
3. Request RESTful API using the GET method.
>curl http://localhost:8080/user-profile
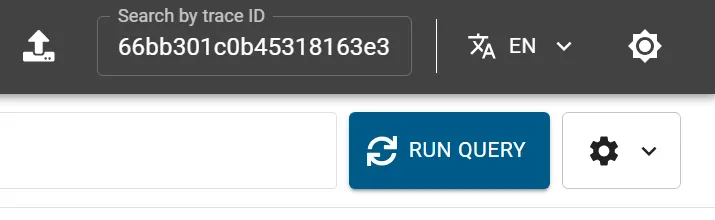
{"username":"John","email":"demo@example.com","traceId":"66bb301c0b45318163e3af5a61b86293"}4. In the console, show trace ID.
2024-08-13T17:06:20.783+07:00 INFO [app-trace-zipkin,66bb301c0b45318163e3af5a61b86293,480a30c4f7def724] 54784 --- [app-trace-zipkin] [nio-8080-exec-2] [66bb301c0b45318163e3af5a61b86293-480a30c4f7def724] c.e.a.services.UserProfileServiceImpl : userProfile.inquiry
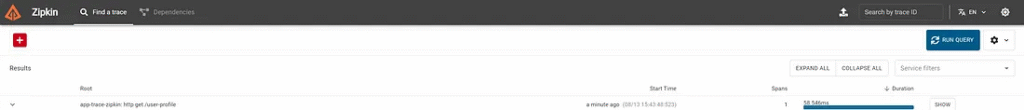
Monitor requests in the Zipkin server.
1. The developer can search the process by using a trace ID.
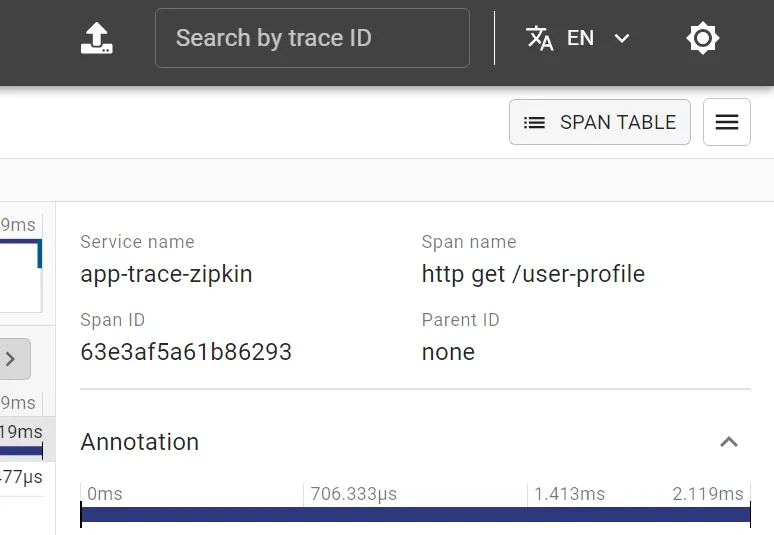
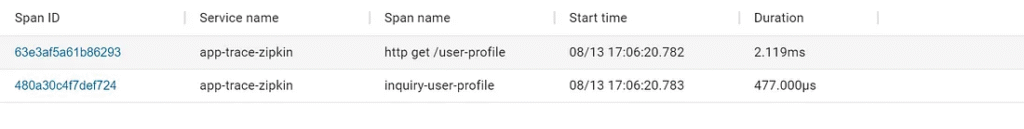
2. When the developer clicks on the “SPAN TABLE” button.
Conclusion
The trace ID from the Slf4j annotation matches the trace ID inside the Zipkin server, so the developer can use the trace ID from the log to search the Zipkin server because it is generated from the micrometer.
Finally
Zipkin benefits the development team by improving performance monitoring through a RESTful API. The developer should learn how to configure a micrometer that helps the developer provide information to the Zipkin server.
When a client sends a request, the developer can instantly trace process performance and the problem, reducing the time it takes to solve it.


