Tracing logs in an application is crucial for determining whether a problem causes an error in the application or an incorrect business process.
The developer relies on a log file to write clues that can help trace a problem in the log file. Tracing log files can be complicated when an application generates hundreds or thousands of log files from different clusters and servers. The developer must filter or narrow a log file to reduce it to a manageable size, also known as a trace.
Grafana Loki can solve this problem by helping developers manage and filter logs. The developer can also view a log in real-time on the Grafana Dashboard. Grafana Loki provides feature queries and filters logs.
The developer can create an initial Spring Boot project from
the Spring initialzr. It helps the developer create a template for a project quickly.

Install Grafana Loki, Grafana dashboards, and Promtail on Docker.
1. Directory structure
/grafana-loki
├── docker-compose.yml
├── loki
│   └── config
│       └── local-config.yaml
└── promtail
    └── config
        └── local-config.yaml
2. Create docker-compose.yml
version: '3.9'

services:
  loki:
    image: grafana/loki:3.0.0
    ports:
      - "3100:3100"
    command: -config.file=/etc/loki/local-config.yaml
    volumes:
      - ./loki/config:/etc/loki
    networks:
      postgres_postgres-network:
        ipv4_address: 172.20.0.5
  grafana:
    image: grafana/grafana:10.4.4
    ports:
      - "3000:3000"
    environment:
      - GF_SECURITY_ADMIN_PASSWORD=admin
      - GF_SECURITY_ADMIN_USER=admin
    volumes:
      - grafana-storage:/var/lib/grafana
    networks:
      postgres_postgres-network:
        ipv4_address: 172.20.0.6
  promtail:
    image: grafana/promtail:3.0.0
    volumes:
      - /var/log:/var/log
      - ./promtail/config:/etc/promtail
    command: -config.file=/etc/promtail/local-config.yaml
    networks:
      postgres_postgres-network:
        ipv4_address: 172.20.0.7
volumes:
  grafana-storage:
networks:
  postgres_postgres-network:
    external: true
3. The developer can discover the latest version of each image.
4. Create a Loki config file local-config.yaml.
auth_enabled: false

server:
  http_listen_port: 3100

common:
  instance_addr: 172.20.0.5
  path_prefix: /loki
  storage:
    filesystem:
      chunks_directory: /loki/chunks
      rules_directory: /loki/rules
  replication_factor: 1
  ring:
    kvstore:
      store: inmemory

schema_config:
  configs:
    - from: 2020-10-24
      store: tsdb
      object_store: filesystem
      schema: v13
      index:
        prefix: index_
        period: 24h

ruler:
  alertmanager_url: http://localhost:9093

# By default, Loki will send anonymous, but uniquely-identifiable usage and configuration
# analytics to Grafana Labs. These statistics are sent to https://stats.grafana.org/
#
# Statistics help us better understand how Loki is used, and they show us performance
# levels for most users. This helps us prioritize features and documentation.
# For more information on what's sent, look at
# https://github.com/grafana/loki/blob/main/pkg/usagestats/stats.go
# Refer to the buildReport method to see what goes into a report.
#
# If you would like to disable reporting, uncomment the following lines:
#analytics:
#  reporting_enabled: false
The developer can download the initial local-config.yaml file.
5. Create a Promtail config file `local-config.yaml`.
server:
  http_listen_port: 9080
  grpc_listen_port: 0

positions:
  filename: /tmp/positions.yaml

clients:
  - url: http://172.20.0.5:3100/loki/api/v1/push

scrape_configs:
- job_name: system
  static_configs:
    - targets:
        - localhost
      labels:
        job: varlogs
        __path__: /var/log/*.log
In the Spring Boot project, the developer configured Logback to send the log to Grafana Loki.
6. Configuration `logback-spring.xml`.
<?xml version="1.0" encoding="UTF-8"?>
<configuration>

    <!-- Define properties for log file locations -->
    <property name="APP_NAME" value="demo_logs" />

    <appender name="STDOUT" class="ch.qos.logback.core.ConsoleAppender">
        <encoder>
            <pattern>%d{yyyy-MM-dd HH:mm:ss} [%thread] %-5level %logger{36} - %msg traceId=%X{traceId} spanId=%X{spanId}%n</pattern>
        </encoder>
    </appender>

    <appender name="LOKI" class="com.github.loki4j.logback.Loki4jAppender">
        <!-- (1) -->
        <http>
            <url>http://localhost:3100/loki/api/v1/push</url>
        </http>
        <format>
            <!-- (2) -->
            <label>
                <pattern>app=${APP_NAME},host=${HOSTNAME},level=%level</pattern>
                <!-- (3) -->
                <readMarkers>true</readMarkers>
            </label>
            <message>
                <!-- (4) -->
                <pattern>%d{yyyy-MM-dd HH:mm:ss} [%thread] %-5level %logger{36} - %msg traceId=%X{traceId} spanId=%X{spanId}%n</pattern>
            </message>
        </format>
    </appender>

    <!-- Root logger configuration -->
    <root level="INFO">
        <appender-ref ref="STDOUT" />
        <appender-ref ref="LOKI"/>
    </root>


</configuration>
7. When a Spring Boot project is deployed on Docker, the developer must change the IP address to 172.20.0.5, which is confined to the Docker network.
Read more about the configuration of the Logback Grafana Loki appender.
Start Grafana Loki, Grafana dashboards, and Promtail.
1. Execute the command to download and start images.
>docker compose up
2. Check that the images were downloaded.
> docker images
REPOSITORY         TAG       IMAGE ID       CREATED        SIZE
grafana/grafana    10.4.4    7f12425a99f1   10 days ago    429MB
grafana/loki       3.0.0     b3ac890121a8   2 months ago   80.4MB
grafana/promtail   3.0.0     dd39094f5519   2 months ago   202MB
3. Check that containers have been started.
docker container ls
CONTAINER ID   IMAGE                    COMMAND                  CREATED          STATUS             PORTS                           NAMES
00f5c42ecfd3   grafana/promtail:3.0.0   "/usr/bin/promtail -…"   42 minutes ago   Up 41 minutes                                      grafana-loki-promtail-1
b24a022e95b5   grafana/grafana:10.4.4   "/run.sh"                42 minutes ago   Up 41 minutes      0.0.0.0:3000->3000/tcp          grafana-loki-grafana-1
f3a22365ea81   grafana/loki:3.0.0       "/usr/bin/loki -conf…"   42 minutes ago   Up 41 minutes      0.0.0.0:3100->3100/tcp          grafana-loki-loki-1
Connect Grafana dashboard and Grafana Loki
1. Login to the Grafana dashboard URL http://localhost:3000
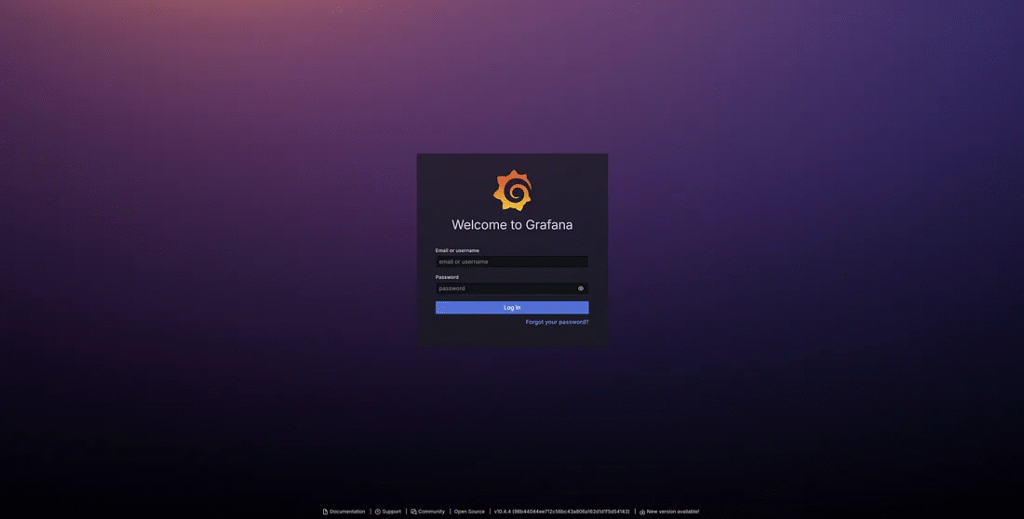
2. The input username and password are confined to `dock-compose.xml`.
3. Add a new data source, Grafana Loki.
Choose menu Connections and sub menu Data sources .
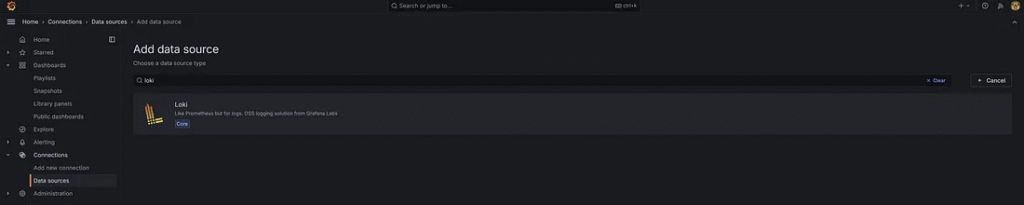
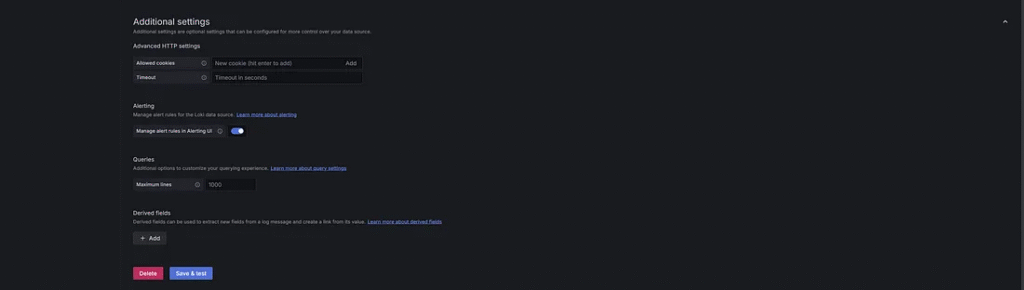
4. Connection with Grafana Loki.
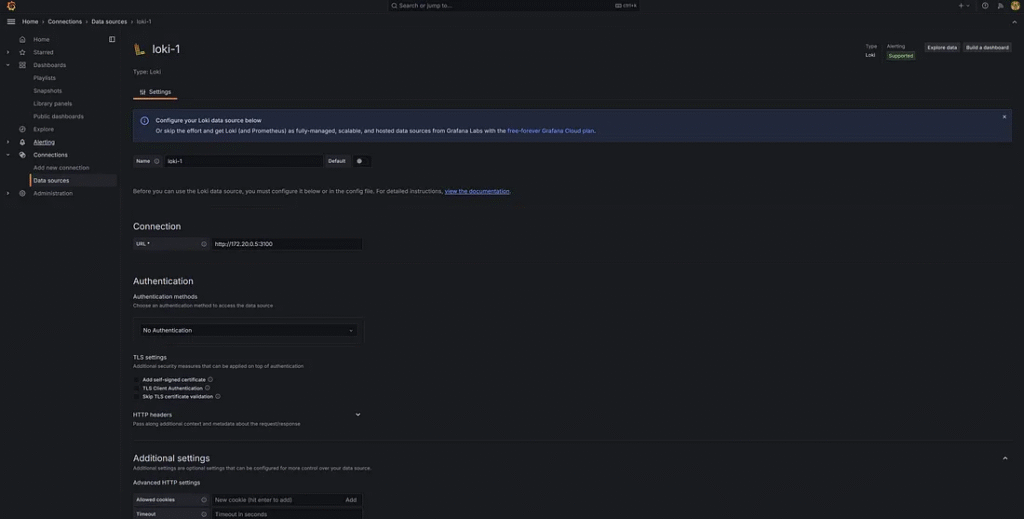
5. Input the name Loki-1 and URL: http://172.20.0.5:3100 to connect to Grafana Loki. Click Save & test Button.
Read more about the setting, Grafana Loki.

Start the application, Spring Boot.
1. In the application log message example from RestController.
import lombok.extern.slf4j.Slf4j;
import org.springframework.beans.factory.annotation.Autowired;
import org.springframework.http.HttpStatus;
import org.springframework.http.ResponseEntity;
import org.springframework.web.bind.annotation.GetMapping;
import org.springframework.web.bind.annotation.PathVariable;
import org.springframework.web.bind.annotation.RequestMapping;
import org.springframework.web.bind.annotation.RestController;

import java.util.List;

@RestController
@RequestMapping("/api/products")
@Slf4j
public class ProductsController {

    @GetMapping(path = "/{productId}", produces = "application/json")
    public ResponseEntity<Object> getUserprofile(@PathVariable String productId) {
        log.info("Example  info  message -> Received product ID {}", productId);
        log.debug("Example debug message -> Received product ID {}", productId);
        log.error("Example error message -> not found product ID {}", productId);
        return new ResponseEntity<>(null, HttpStatus.OK);
    }

}
2. Start the Spring Boot application.
>mvn package
>java -jar target/demo-0.0.1-SNAPSHOT.jar
The developer can deploy the Spring Boot application on Docker.
View the log message in the Grafana dashboard.
When the application starts, it sends a log to the Grafana Loki server, which is displayed on the Grafana dashboard.
1. In the Grafana dashboard, go to Exeplorer Menu.
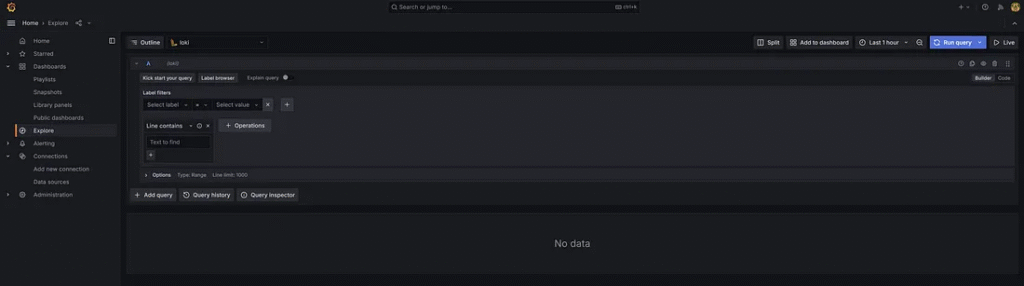
2. The Developer selects Label filters.
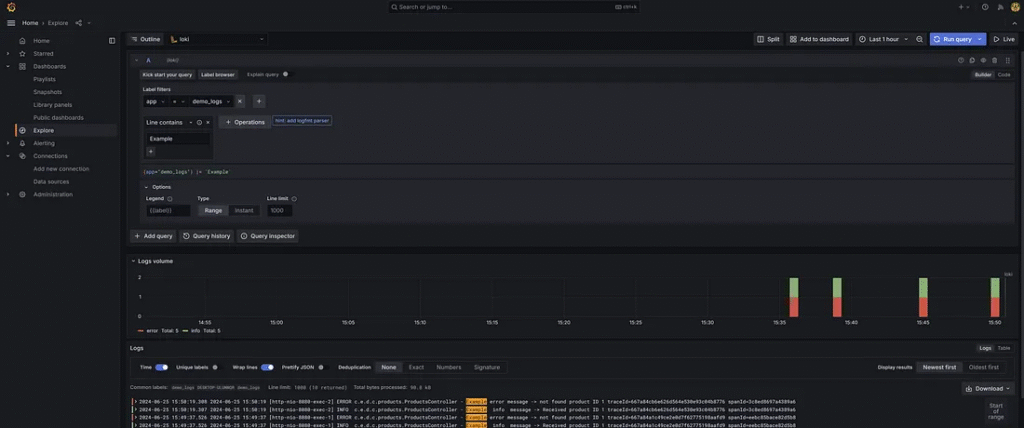
3. The Line contains input. Example For query log messages containing the word Example Only that helps the developer find an involved log process effectively.
  {
    "line": "2024-06-25 15:50:19 [http-nio-8080-exec-2] INFO  c.e.d.c.products.ProductsController - Example  info  message -> Received product ID 1 traceId=667a84cb6e626d564e530e93c04b8776 spanId=3c8ed8697a4389a6\r\n",
    "timestamp": "1719305419307307000",
    "fields": {
      "app": "demo_logs",
      "host": "DESKTOP-ULUNNQR",
      "level": "INFO",
      "service_name": "demo_logs"
    }
  },
4. The developer can query by trace ID to identify which log uses the same request or process.
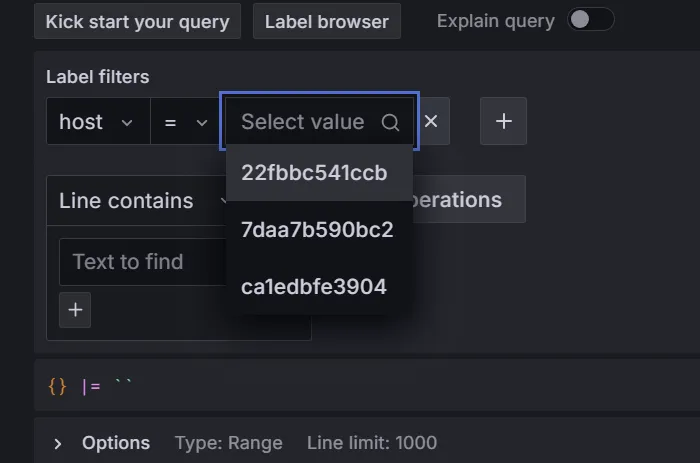
Application replicas on Docker.
An application in Docker: The developer can filter logs for each container by hostname.
Read more about Grafana Exeplorer.

Finally
Grafana Loki offers several benefits for log management and monitoring, particularly in the modern context. It works seamlessly with Grafana and provides LogQL and Label-based Filtering features. The developer should use observability and logging tools that improve overall development team performance to find and solve problems.
This article was originally published on Medium.