
Monitoring website performance is crucial. With real-time analytics, you can gain a deeper understanding of user behavior, optimize content, and make informed, data-driven decisions. Next.js, a popular React framework, offers built-in support for performance monitoring. In this guide, we’ll walk through several methods to integrate analytics into your Next.js app.
Why Use Analytics in Next.js?
Analytics help you track key metrics, including page views, user interactions, bounce rates, and other relevant data. Without them, you’re flying blind. Whether you’re running a blog, an e-commerce store, or a SaaS product, data is your compass.
Fortunately, Next.js simplifies the integration process. Let’s explore your options.
Client-Side Instrumentation
Client-side instrumentation involves manually collecting and sending performance data. This gives you complete control over what you track.
Start by creating a file named instrumentation-client.ts. In this file, define the logic to capture web vitals:
// Initialize analytics before the app starts
console.log("Analytics initialized");

// Set up global error tracking
window.addEventListener("error", (event) => {
  // Send to your error tracking service
  reportError(event.error);
});
Using the useReportWebVitals Hook
If you want a more straightforward method, Next.js provides the useReportWebVitals hook. This hook captures web vitals automatically and lets you send them wherever you want.
import { useReportWebVitals } from 'next/web-vitals';

function MyApp({ Component, pageProps }) {
  useReportWebVitals((metric) => {
    console.log(metric);
    // Replace with your analytics handler
  });

  return <Component {...pageProps} />;
}

export default MyApp;
This method works well for developers who wish to capture performance data without writing excessive boilerplate code. The hook provides metrics like FCP, TTFB, CLS, and more. Each metric comes with values and context, helping you diagnose issues in production.
A key benefit here is automation. You don’t need to track everything manually. Next.js handles the heavy lifting, allowing you to focus on interpreting the data.
This setup is excellent for teams using Google Analytics or Vercel Analytics. Just forward the metrics to your preferred service. You’ll get powerful insights with minimal configuration.
'use client'

import { useReportWebVitals } from 'next/web-vitals'

export function WebVitals() {
  useReportWebVitals((metric) => {
    switch (metric.name) {
      case 'FCP': {
        // handle FCP results
      }
      case 'LCP': {
        // handle LCP results
      }
      // ...
    }
  })
}
Sending Results to External Systems
After collecting performance data, you need to send it to a designated location. Most analytics platforms require you to use window.gtag or similar methods to transmit the data.
Here’s how to send metrics to Google Analytics:
export function reportWebVitals(metric) {
  window.gtag('event', metric.name, {
    event_category: 'Web Vitals',
    value: Math.round(metric.value),
    event_label: metric.id,
    non_interaction: true,
  });
}
You’ll need to include the GA tracking script in your _document.tsx or via Google Tag Manager. Also, ensure that the window.gtag function is loaded before calling it.
This method is powerful because it lets you combine multiple data sources. For example, you can send custom metrics to Google Analytics while forwarding core vitals to Vercel.
Moreover, you can adapt this strategy for other platforms, such as Mixpanel, Amplitude, or even your internal dashboards. Just change the reporting logic accordingly.
The goal here is to centralize your data. By sending metrics to external systems, you unlock visualization tools and performance dashboards, enabling you to gain deeper insights into your data. That helps you monitor KPIs and identify bottlenecks quickly.
Use Vercel Analytics for a Managed Solution
If you’re deploying on Vercel, things get even easier. Vercel offers a managed analytics solution that automatically captures performance metrics. There’s no setup required. Just enable the feature in your dashboard.
Here’s why many developers prefer Vercel Analytics:
- It requires zero configuration.
- It captures Core Web Vitals out of the box.
- It integrates seamlessly with your Next.js app.
- It offers intuitive charts and real-time data.
This is ideal for teams that prioritize speed and reliability. You don’t need to write custom tracking scripts or install third-party SDKs. Deploy your app, and Vercel takes care of the rest.
Additionally, you can combine Vercel Analytics with custom event tracking. Use window.gtag or your logic to extend the insights further. This hybrid approach gives you both automation and control.
Best Practices for Analytics in Next.js
To get the most out of your analytics, follow these tips:
- Use environment checks: Only send data in production. Wrap your logic in
if (process.env.NODE_ENV === 'production'). - Batch your events: If your app sends a large number of events, consider batching them to minimize network overhead.
- Avoid blocking rendering: Never delay rendering to capture a metric. Analytics should be non-blocking.
- Respect privacy laws: Implement consent mechanisms for tracking cookies and data collection to ensure compliance.
- Monitor trends: Use dashboards to detect performance regressions over time.
Example website
App Router that integrates HeroUI (@heroui/react) and uses useReportWebVitals to log metrics—without sending data to any external service.
Project structure
my-nextjs-app/
├── app/
│   ├── example/
│   │   └── page.tsx
│   ├── page.tsx
│   └── layout.tsx
├── components/
│   └── WebVitalsLogger.tsx
├── styles/
├── .gitignore
├── next.config.js
├── package.json
├── instrumentation-client.ts
└── tsconfig.json
Web Vitals Logger
Create a client component in app/components/WebVitalsLogger.tsx:
'use client'
import { useReportWebVitals } from 'next/web-vitals'
export function WebVitalsLogger() {
useReportWebVitals(metric => {
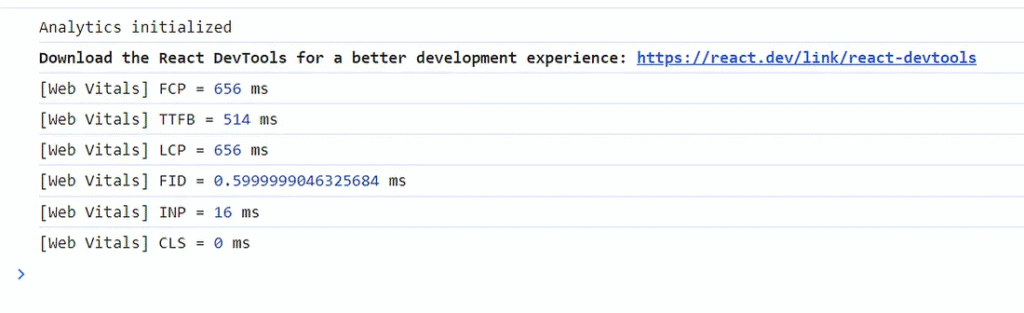
console.log('[Web Vitals]', metric.name, '=', metric.value, 'ms')
})
return null
}This logs metrics like FCP, LCP, CLS, hydration, mounting time, and route-change renders
Setup Layout
import './globals.css'
import { WebVitalsLogger } from './components/WebVitalsLogger'

export default function RootLayout({ children }) {
  return (
    <html lang="en">
      <body>
          <WebVitalsLogger />
          {children}
      </body>
    </html>
  )
}
Example Page
A simple homepage in app/example/page.tsx:
import { Button, Input } from '@heroui/react'
import { useState } from 'react'
export default function HomePage() {
const [name, setName] = useState('')
return (
<main className="flex flex-col items-center justify-center min-h-screen p-8">
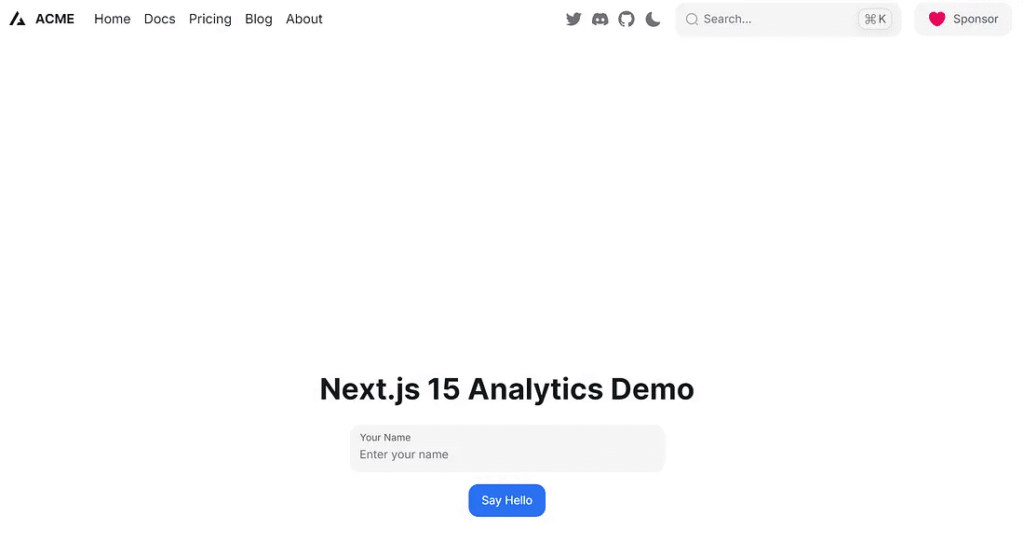
<h1 className="text-4xl font-bold mb-6">Next.js 15 Analytics Demo</h1>
<Input
label="Your Name"
placeholder="Enter your name"
value={name}
onValueChange={setName}
className="mb-4 w-full max-w-sm"
/>
<Button color="primary" onPress={() => alert(`Hello, ${name || 'stranger'}!`)}>
Say Hello
</Button>
</main>
)
}Web Vitals Logger captures and logs performance data client-side via useReportWebVitals, without sending it externally.
Running the Project
npm run dev
Access the example page
http://localhost:3000/example
Analytic in the console log.
Additional
To filter logs, wrap metrics:
if (metric.rating === 'poor') console.warn(metric)
Add only production logging:
if (process.env.NODE_ENV === 'production') { … }Conclusion
Adding analytics to your Next.js app doesn’t have to be complicated. Whether you build a custom solution or use a managed service like Vercel Analytics, Next.js offers the tools to support your goals.
Start small — track web vitals. Then expand your setup with custom events and third-party integrations. Your users will enjoy faster, more responsive experiences, and your business will gain deeper insights.
Now that you know how to add analytics to your Next.js app, it’s time to put it into action. Monitor, optimize, and grow — one metric at a time.
This article was originally published on Medium.


This article is super helpful for understanding Next.js web vitals! The examples and insights make it easy to implement analytics without feeling overwhelmed. Great real-world tips for developers.
Great article! It’s incredibly helpful for setting up Web Vitals tracking in Next.js. The examples, especially with Vercel Analytics, make implementation feel straightforward. Really appreciate the clear guidance on integrating with external tools too.